
Getting inventory reorders wrong is costly.
On the one hand, excess inventory increases capital costs, storage space costs, service costs, and inventory risk costs. It also results in the degradation of the goods themselves. On the other hand, not having enough inventory creates supply chain bottlenecks and production and delivery delays.
Finding this balance is represented by a popular formula: Economic Order Quantity (EOQ). The EOQ is determined based on a combination of knowing how much stock is already on hand (inventory management) and what is likely to be sold (demand forecasting).
But calculating the EOQ is not straightforward. In today’s world of consumerism, reorder levels can’t be calculated with constant year over year demand, holding costs, and delivery costs. Product life cycles have unique trajectories, buyers switch easily depending on expected delivery times and rates, and manufacturers are at the mercy of economic health. Regardless of too much or not enough stock, it’s the bottom line that suffers when this isn’t managed efficiently.
Existing Inventory Management Tools Are Not Sophisticated Enough
There’s an additional hurdle for purchasers to overcome: Existing software tools usually come up short in their offerings. Specifically:
-
They’re not integrative and can’t plug into existing systems (or at least not without significant IT involvement and potentially complicated workarounds) for calculating both demand and supply
-
There are limited analyses that can be performed on the data – purchasers are bound to only what’s available in the software
-
There are significant limitations to how the software and user can interact – which is mostly a result of a black-box interface
Due to the complexities of today’s society and shortcomings of existing software programs, purchasers and their IT teams turn to more modern data analysis tools for calculating the EOQ.
A Modern Data Tool for A Complex Calculation
Modern data tools overcome the limitations of black-box software solutions by enabling teams to create custom solutions, without having to start from scratch with coding. IT teams can use advanced data science to create interactive data applications without coding (although things don’t have to be advanced, and coding is possible if needed).
KNIME Analytics Platform offers the ideal environment for data engineers to build a custom data application, which purchasers can use when calculating the EOQ. A huge benefit for organizations is that customization is possible without requiring scripting an application from scratch. Everything to build this EOQ calculator is readily available within KNIME.
Building a Bespoke EOQ Calculator
In this article, we run through how an example EOQ Calculator would work. Every assumption in this piece can be changed to accommodate the purchasers bespoke needs.
Typically, a purchaser's biggest concern is when to re-order and how much to re-order. With the introduction of KNIME-built data apps, much of this process can be automated and streamlined. Below, see an example of everything that’s happening behind the scenes.
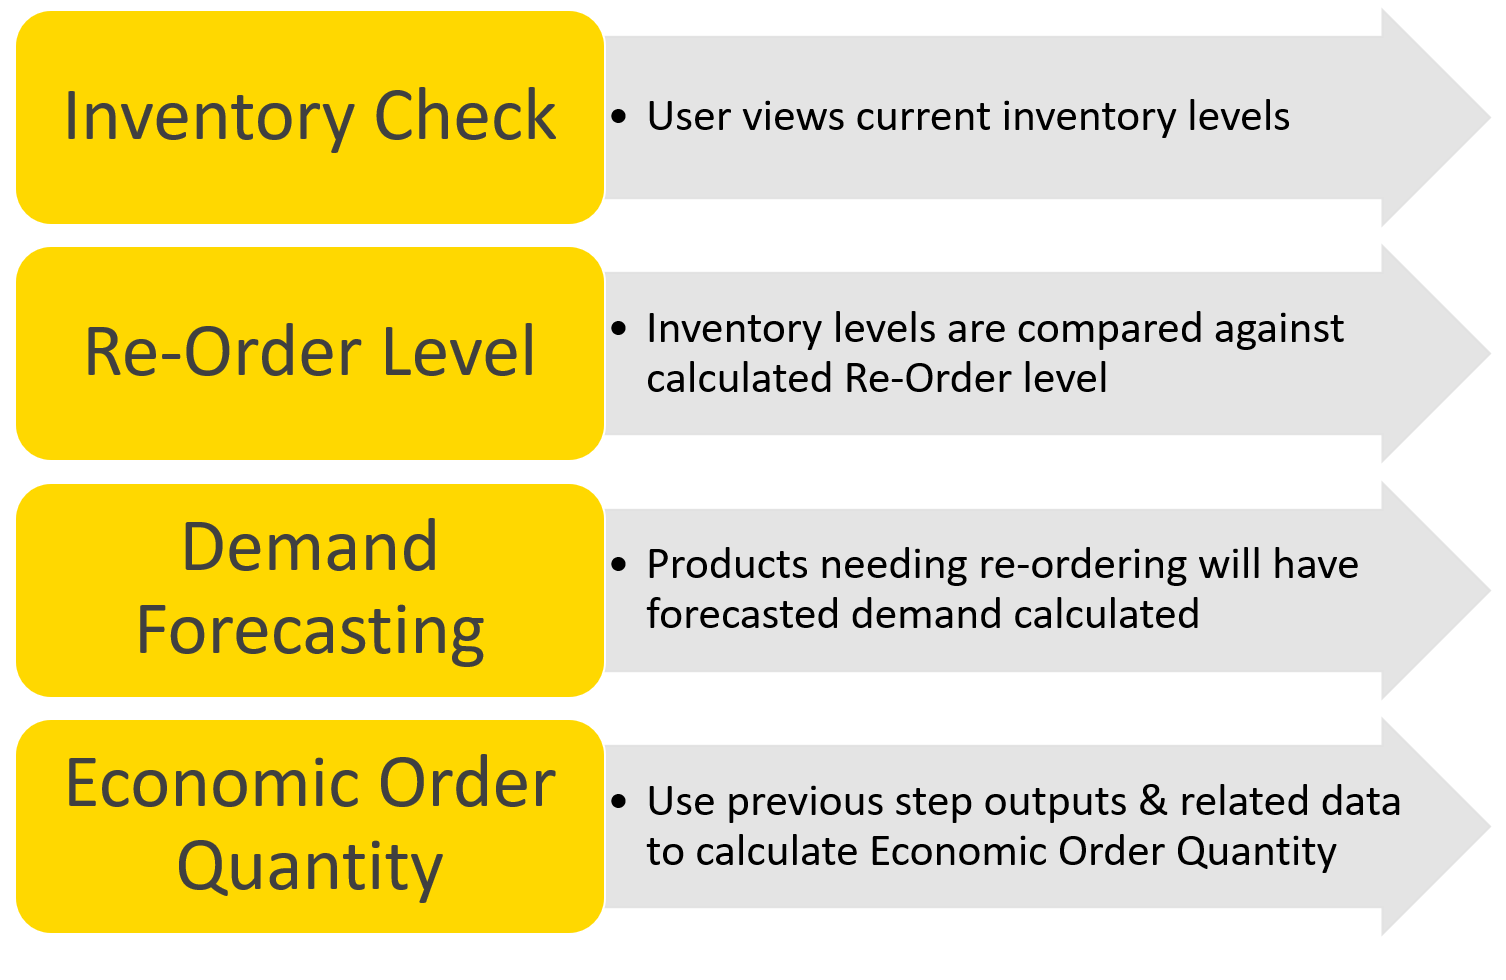
It’s also easy to make changes when needed – such as reading in a new data source from a new location or adding an additional step in the analysis. KNIME ensures that this process is standardized and that decisions are made based on the same logic each time, but it’s also possible for the process to be easily adjusted in the backend if and when needed. Lastly, any existing software can be integrated into KNIME.
The following section includes a simple example of a data application built using KNIME. It highlights one way a purchaser can calculate the EOQ.
Situation: A manufacturing company with multiple warehouses and products for which the inventory levels need to be managed.
While the main objective is to determine the EOQ, this is only necessary when product levels have fallen below the reorder point. With KNIME, the data app can be scheduled to consistently check and notify what products qualify for reorder.
Once it’s clear what products need to be reordered, the purchaser can then determine how much to reorder. This introduces the difficulty of balancing both forecasted and historical demand. Reordering creates a lot of uncertainty since it’s based on multiple factors: Current inventory levels, shipping times, and day-to-day expected demand. And there’s never a correct answer for what to reorder because of unforeseen and unavoidable delivery delays, or days where there is particularly high demand.
This data application is just one way these complexities and challenges can be managed.
Step One: Confidence Depending on Risk Threshold is Calculated
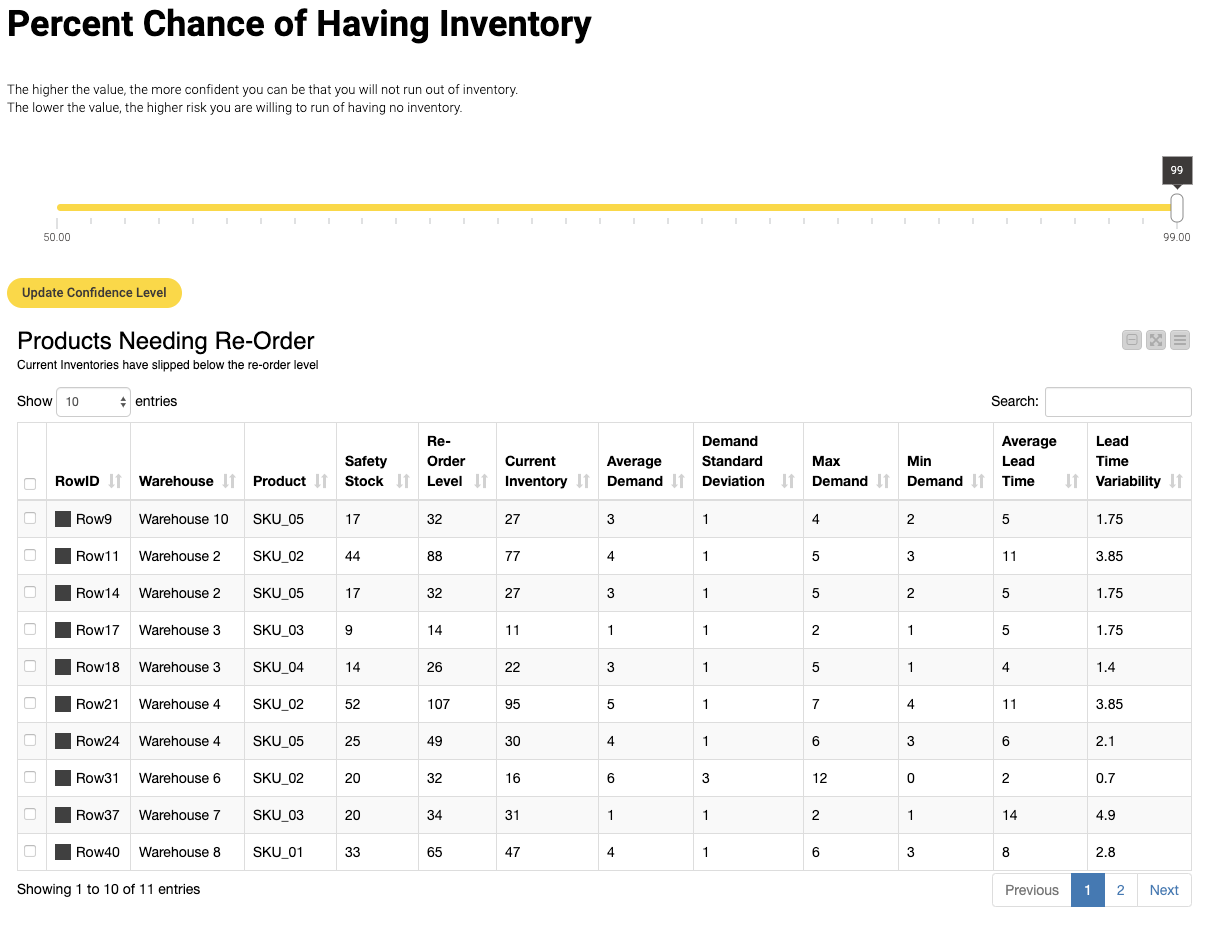
The first thing this particular data app offers is a confidence spectrum, which is reliant on two things: previous demand and the organization’s threshold for risk. Typically there are varying levels of confidence. These range from “I never want to run out of inventory”, whereby purchasers would reorder more frequently and hold higher inventories, through to “I have customers where time is not of the essence and I’d rather not pay the holding cost for this extra inventory.” These purchasers tend to hold lower inventories.
As shown below, at 99% confidence the data application displays the products that a purchase should ideally reorder quickly to ensure they don’t fall victim to supply chain delays, variable shipping times, or for a flood in demand that will result in running out of inventory. Typically, at this confidence level, more products are listed.
On the other hand, at 90%, there are only three products needing to be reordered. In this case, the organization feels that this is the appropriate level of risk and is comfortable operating with the 10% chance of running out of stock.
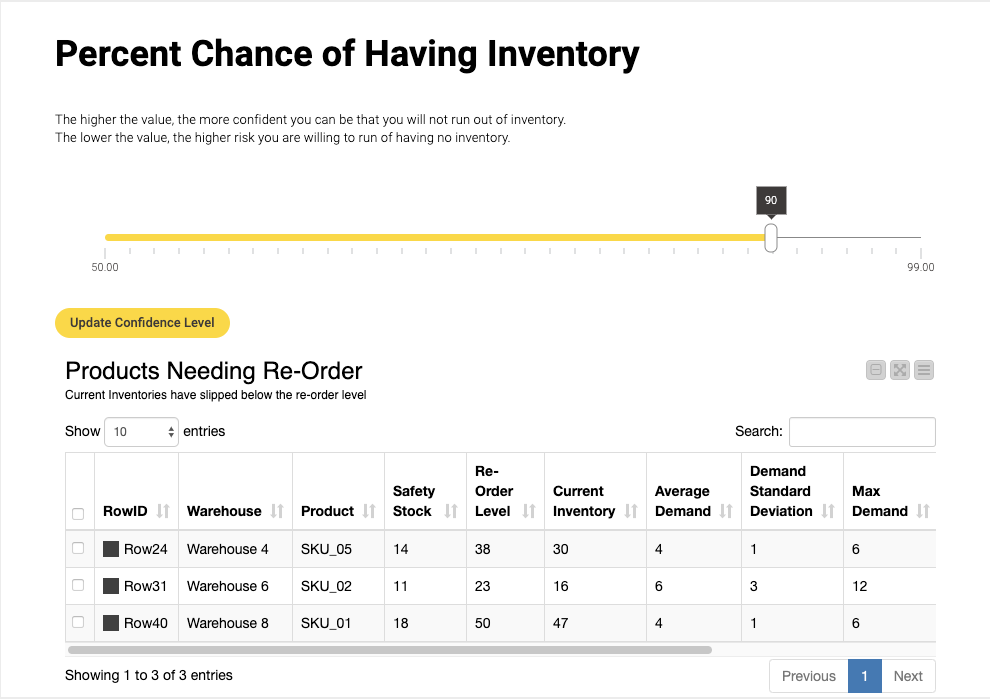
It’s worth noting that many organizations already know what level of risk they are willing to take regarding inventory levels. In these cases, it’s possible to adjust the data application settings so that the confidence level widget isn’t available to the purchaser. Instead, it can be set to remain at the approved value. In this case, for example, the data engineer would simply remove the slider widget functionality in the backend and set the approved risk level for calculating the reorder value.
Understanding the need to reorder based on current levels of inventory is an important step in determining the EOQ. This highlights what products need to be analyzed and to find their corresponding EOQ value so purchasers know what products to reorder and in what quantity. Knowing current inventory levels is essential, particularly for businesses balancing a wide variety of products that are dispersed across different warehouses.
Step Two: Demand Based on Previous Year’s Trends is Forecasted
Before being able to forecast demand, purchasers should also analyze previous years’ demand trends. This demand review analyzes historic data to ensure that demand is still holding expected trends. It confirms whether there has been any obvious change in demand trends or if there are specific outliers that might skew the data. As shown in Figure 4, a scatterplot visualizes how demand changes over time and highlights outliers in red. Other visualizations can also be built into the data application as needed.
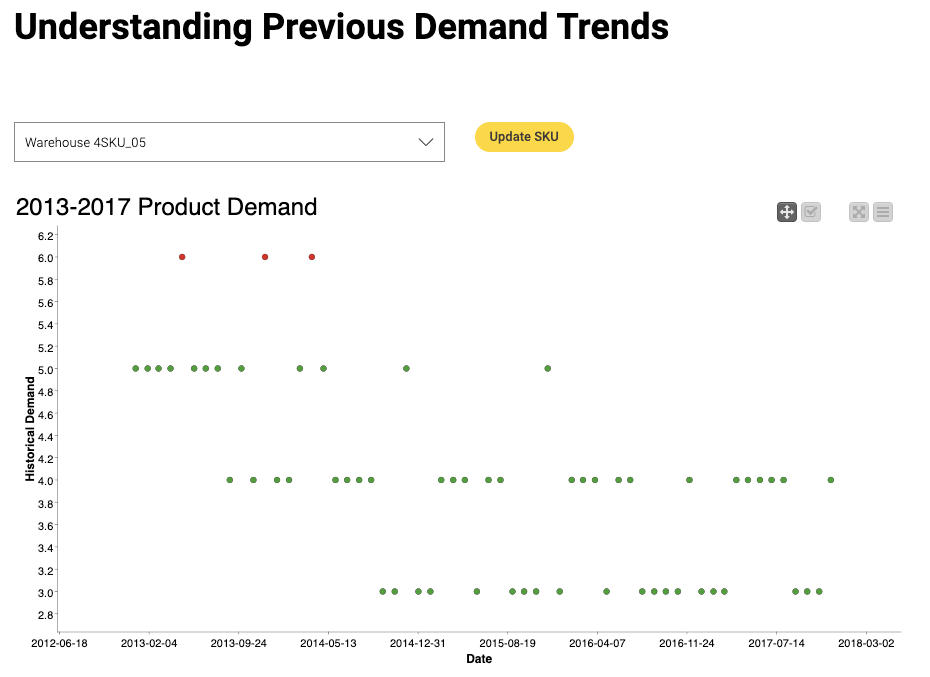
In this case, Linear Regression has been used because it's simple, stable, and provides sufficient quality predictions for this application. If the underlying system is more complex and can't be modeled, then KNIME Analytics Platform also offers plenty of other models that can model more complex dependencies for instance polynomial regression, regression trees, neural networks, to name just three.
Step Three: Economic Order Quantity is Calculated
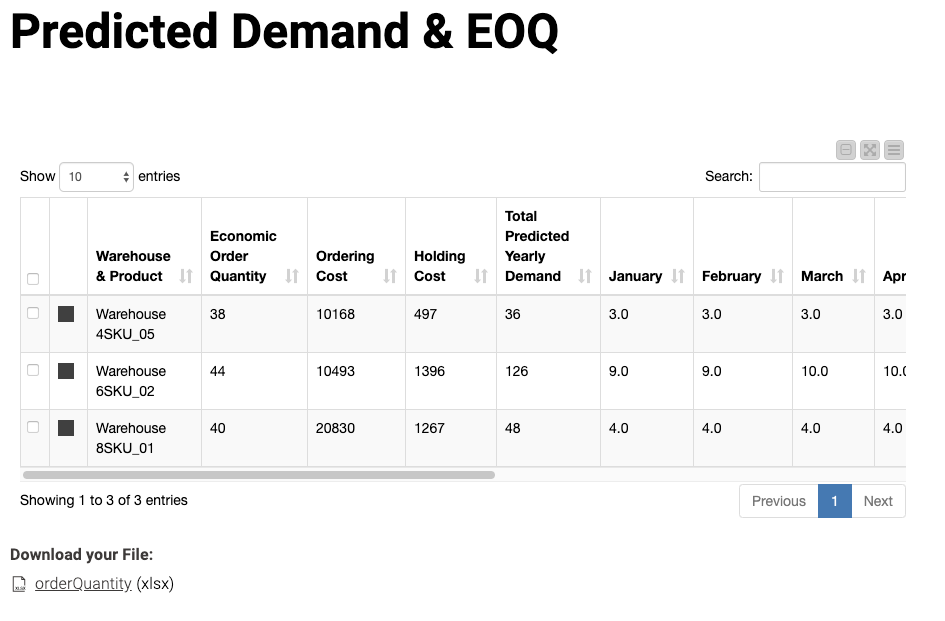
Finally, it’s possible to use the values generated along with both the holding costs per unit and order costs to derive the final EOQ value (see Figure 5). This is the value that the purchaser uses to make a purchase order. It’s also possible to configure these values to be passed automatically to the procurement or buyers’ software – assuming an API is possible on the buyer’s side.
It’s worthwhile mentioning that the model should be regularly checked to ensure it’s performing accurately (this is best practice for any modeling!). It gives purchasers the confidence that it’s providing the best results and accounting for environmental changes. The model may also need to be adjusted to align with different business needs or data.
Data-Driven Decisions Keep Both the Business and Users Happy
Data apps are great not only for reducing the limitations of how users and software interact, but also for providing an easy way of including advanced data science into business processes without needing to train business users in data science. IT teams, together with purchasers, can build custom solutions that can be reused, shared, and easily extended or adapted. Ultimately saving organizations time and money.
The result: Purchasers get access to just the right touchpoints for making data-driven decisions. Purchasing Managers are happy because they have the right amount of stock on hand without the additional costs and risk.
Curious how it works underneath the hood? Try the free and open source KNIME Analytics Platform and play around with the workflow described in this post. Download KNIME.