Key Takeaways
-
With Delta-p statistics, the predictions based on a logistic regression model are easy to understand by non-technical decision-makers.
-
Learn how to calculate the Delta-p statistics based on the coefficients of a logistic regression model for credit application processing.
-
Data workflow includes the steps for accessing the raw data to training the logistic regression model, and evaluating the effects of individual predictor columns with Delta-p statistics.
-
Keep in mind logistic regression might not be the best choice when working with high dimensional data, with many correlated predictor columns.
Imagine a situation where a credit customer applies for a credit, the bank collects data about the customer - demographics, existing funds, and so on - and predicts the credit-worthiness of the customer with a machine learning model. The customer’s credit application is rejected, but the banker doesn’t know why exactly. Or, a bank wants to advertise their credits, and the target group should be those who eventually can get a credit. But who are they?
In these kinds of situations, we would prefer a model that is easy to interpret, such as the logistic regression model. Delta-p statistics make interpretation of the coefficients even easier. With Delta-p statistics at hand, the banker doesn’t need a data scientist to be able to inform the customer, for example, that the credit application was rejected, because all applicants who apply credit for education purposes have a very low chance of getting a credit. The decision is justified, the customer is not personally hurt, and he or she might come back in a few years to apply for a mortgage.
In this article, we explain how to calculate the Delta-p statistics based on the coefficients of a logistic regression model. We demonstrate the process from raw data to model training and model evaluation with a KNIME workflow where each intermediate step has a visual representation. However, the process could be implemented in any tool.
Assessing the Effect of a Single Predictor with the Delta-p Statistics
Logistic Regression Model
When we use the logistic regression algorithm for classification, we model the probability of the target class, for example, the probability of a bad credit rating, with a logistic function. Let’s say we have a binomial logistic regression model with a target column y, credit rating, with two classes that are represented by 0 (good credit rating) and 1 (bad credit rating). The log odds of the target class (y=1) vs. the reference class (y) is a linear combination βx of the predictor columns x (account balance, credit duration, credit purpose, etc.). A logistic function of βx transforms the log odds into a probability of the target class:

where β is the vector of coefficients for the predictor columns xin the logistic regression model that predicts the target class y.
The target and reference classes can be arbitrarily chosen. In our case, the target class is “bad credit rating,” and the reference class is “good credit rating.”
Delta-p Statistics
If the single predictor column xi is continuous, the coefficient βicorresponds to the change in the log odds of the target class when xi increases by 1. If xi is a binomial column, the coefficient value βi is the change in the log odds when xi changes from 0 to 1. The change in the probability of the target class is provided by the logistic function, as shown in Figure 1.
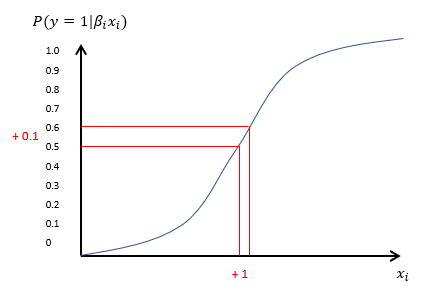
Figure 1. Logistic function modeling the probability of the target class y=1 as a function of one continuous predictor column xi
The Delta-p statistics transforms the coefficient values βi into percentage effects of single predictor columns to the probability of the target class compared to an average data point e.g., an average credit applicant.
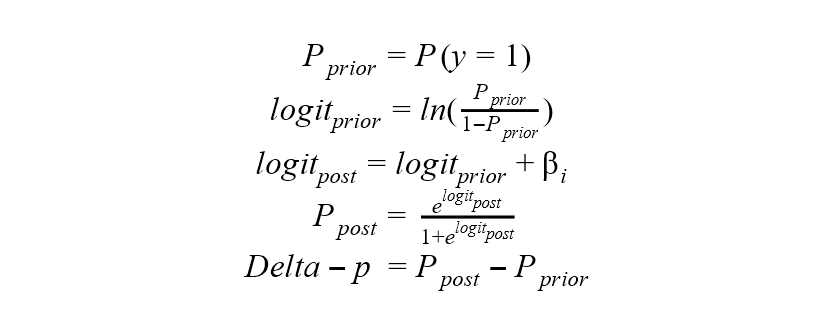
By definition, the Delta-p statistic is a measure of the discrete change in the estimated probability of the occurrence of an outcome given a one-unit change in the independent variable of interest, with all other variables held constant at their mean values. For example, if the Delta-p value of a predictor column xi is 0.2, then a unit increase in this column (or a change from 0 to 1 in a binomial column) increases the probability of the target class by 20 %. The following formulas show how to calculate the prior and post probabilities of the target class and, finally, the Delta-p statistics as their difference1:
Use Case: The Effect of Credit Purpose and Current Account Balance on Credit Rating
Let’s now demonstrate this with an example, and check how the credit purpose and balance of an existing account improves or worsens the credit rating. We use the German credit card data provided by the UCI Machine Learning Repository. The dataset contains 21 columns that provide information about demographics and economic conditions of 1,000 credit applicants. Thirty percent of the applicants have a bad credit rating, and 70 % have a good rating. You can download the data in .data format by clicking “Data Folder” on top of the page, and selecting the “german.data” item on the next page. The german.data file can be opened in a text editor and saved, for example, in csv format. The column names and descriptions of the values in the categorical columns are provided in the german.doc file, accessible via the same “Data Folder” page.
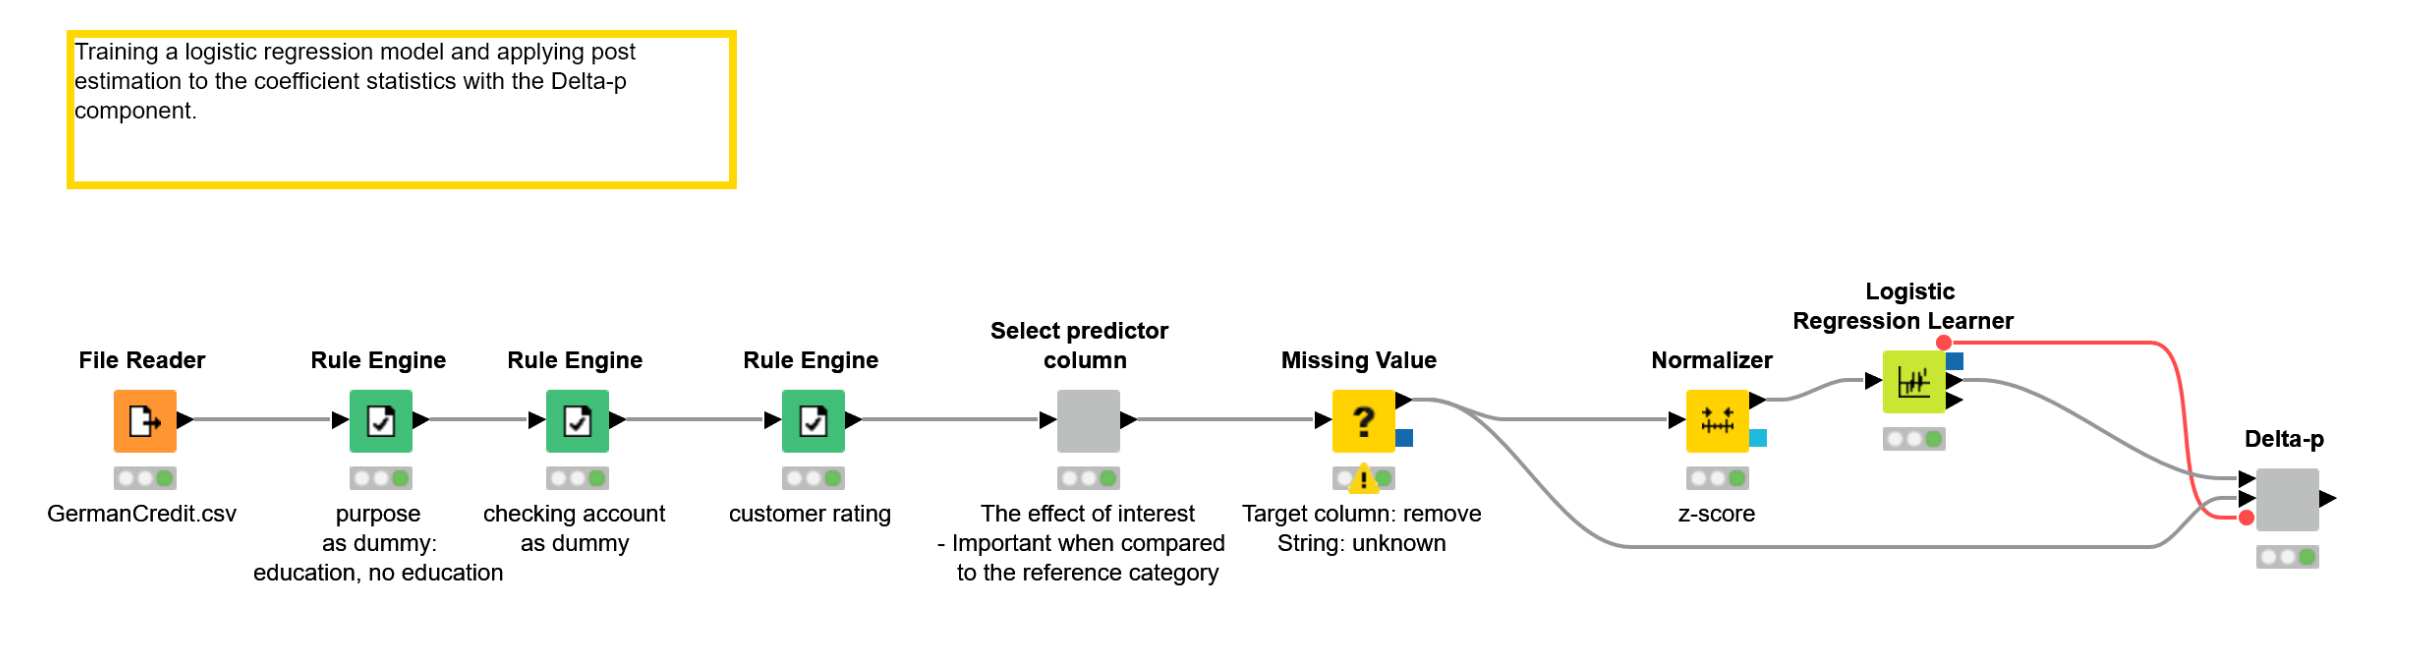
The workflow in Figure 2 shows the process from accessing the raw data to training the logistic regression model, and evaluating the effects of individual predictor columns with Delta-p statistics.
The process is divided into the following steps, each one implemented within a separate colored box: Accessing data (1), preprocessing data as required by a logistic regression model (2), training the model (3), and calculating the Delta-p statistics based on the model coefficients (4). In the preprocessing step, we convert the target column from the 1/2 notation to “bad”/“good.” We also transform two originally multinomial columns into binomial columns: We encode the “checking” column into two values “negative”/“some funds or no account” based on the status of the existing bank account. We encode the “purpose” column into values “education”/“no education” to assess the effect of education as a credit purpose. Finally, we handle missing values and normalize the numeric columns in the data.
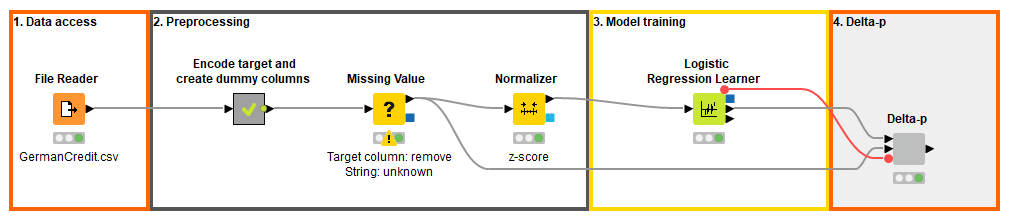
Figure 2. The process from accessing raw credit customer data to training a credit rating model, and to evaluating the effects of predictor columns to the credit rating with Delta-p statistics. This solution was built in KNIME Analytics Platform, and the Assessing Effects of Single Predictors with Delta-p workflow can be inspected and downloaded on the KNIME Hub.
Figure 3 shows the coefficient statistics of the logistic regression model, reproducible in any tool. The “Coeff.” column shows the coefficient values for the different predictor columns, 0.683 for purpose=education. The “P>|z|” column shows the p-values of the coefficients, 0.055 for purpose=education. This means that education as a credit purpose increases the probability of a bad credit rating, since the coefficient value is positive, and this effect is significant at 90 % significance level, since the p-value is smaller than 0.1.
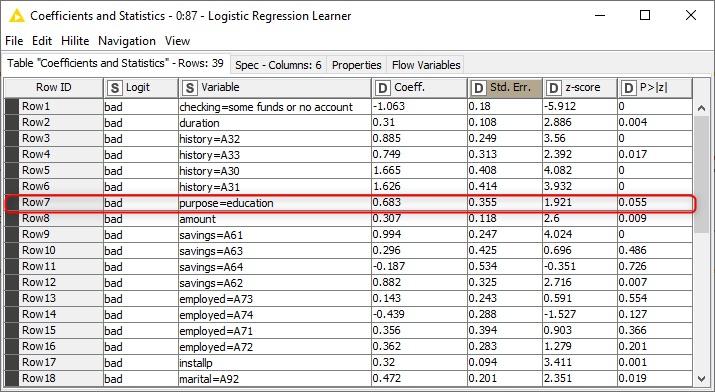
Figure 3. Coefficient statistics of a logistic regression model that predicts the credit rating good/bad of a credit applicant
By looking at the coefficient statistics of the logistic regression model, we find out that education as a credit purpose increases the probability of a bad credit rating compared to other credit purposes. In addition, the coefficient value 0.683 tells that the log odds ratio for getting a bad credit rating with/without education as the credit purpose is 0.683, and the odds ratio of the two groups is e0.683=1.979. What would this mean, for example, in a group of 100 credit applicants, let’s say 20 of them with education as the purpose (group 1) and the remaining 80 with another purpose (group 2)? If 10 out of the 80 applicants in the group 2 have a bad credit rating, so their odds is 0.125, then according to the odds ratio 1.979, the odds for the group 1 must be ~2 times the odds of the group 2, so 0.25 in this case. Therefore 5 (a quarter) of the applicants in the group 1 must have a bad credit rating!
The coefficient statistics have a universal scale, and we can use them to compare the magnitude and the effect of different predictor columns. However, to understand the effect of a single predictor, the Delta-p statistics provide an easier way! Let’s take a look:
In Figure 4 you can see the Delta-p statistics and the intermediate results in calculating it, also shown below for the purpose=education variable:
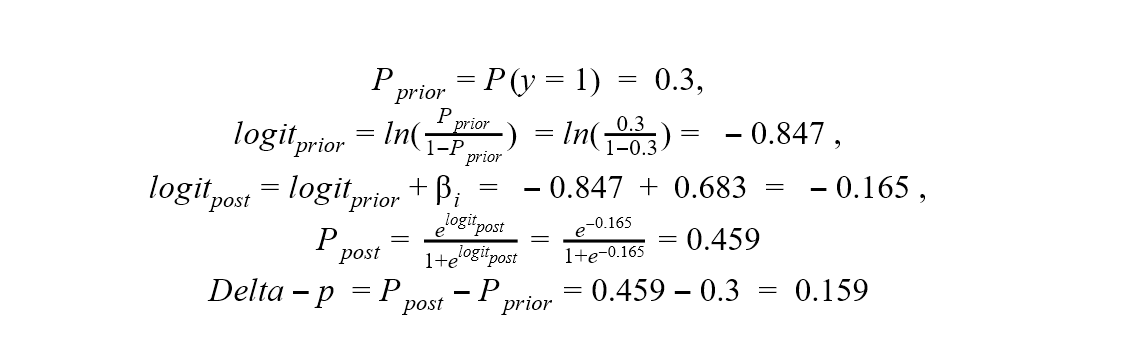
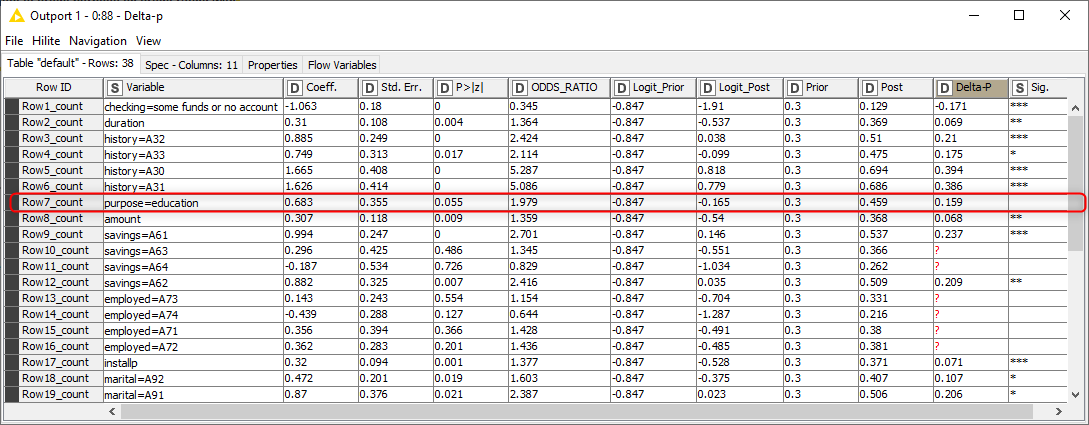
Figure 4. Delta-p statistics, its intermediate results, and the corresponding coefficient statistics of a logistic regression model that predicts the credit rating good/bad of a credit applicant
The value 0.159 of the Delta-p statistics indicates that education as a credit purpose increases the probability of a bad credit rating by 15.9 % compared to an average credit application.
If we wanted to compare the effect to the opposite situation, i.e., the credit purpose is not education, instead of an average credit applicant, we would need to recalculate the prior probability and also mean-center the binomial values of the predictor column of interest xi. In our data, 5 % of the people apply the credit for education purposes, so the mean of the “purpose” column xiis 0.05 .
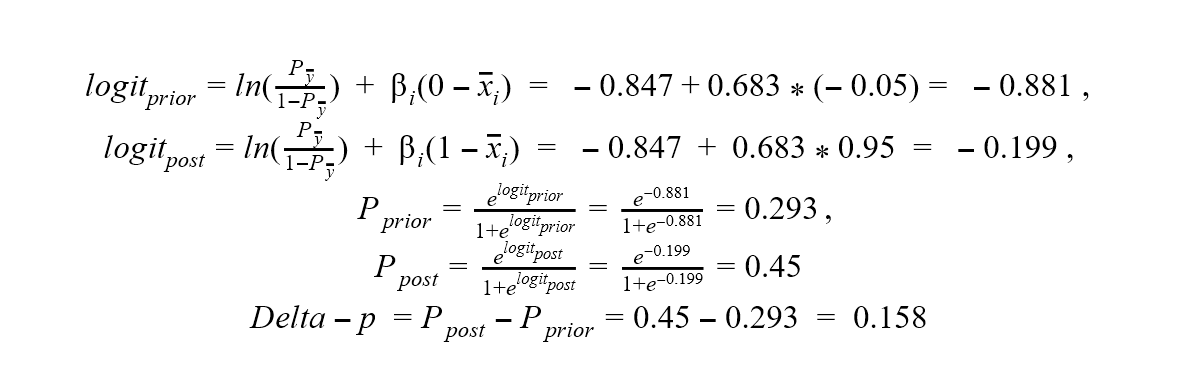
The value 0.158 of the Delta-p statistics indicates that the credit applied for education purposes increases the probability of a bad credit rating by 15.8 % compared to those who apply it for other purposes. There’s hardly any difference to the previous situation where we compared against an average applicant and obtained the Delta-p value 0.159 (Figure 4). This means that the credit applicants with other purposes than education are very close to the sample average in terms of their credit rating, apparently because they make up 95% of the total sample.
Now we know that applying credit for education purposes has a negative effect on the credit rating. Which column could have a positive effect? Let’s check the effect of the other dummy column that we created, the “checking” column that tells if the balance of the existing account is negative. The coefficient value of checking=some funds or no account is -1.063 with a p-value 0, as you can see in the first row in Figure 3.
As the Delta-p statistics -0.171 in the first row in Figure 4 show, credit applicants with no negative account balance tend to have a 17.1 % lower probability of a bad credit rating than an average credit applicant. Interestingly, we found two columns, purpose and checking, that have an effect of almost the same size but a different direction. If we look at the odds ratio of these two variables in Figure 4, we wouldn’t get the same information at first glance: The odds ratio is 0.345 for checking=some funds or no account and 1.979 for purpose=education.
Conclusions
In this article, we have introduced Delta-p statistics as a straightforward way of interpreting the coefficients of a logistic regression model. With Delta-p statistics, the predictions based on a logistic regression model are easy to understand by non-technical decision-makers.
We used Delta-p statistics to assess the individual effects that make a credit application succeed or fail. Of course, the use cases of Delta-p statistics are many more. For example, we could use Delta-p statistics to determine the individual touchpoints that decrease or increase the customer satisfaction the most, or to find the symptoms with the highest relevance, when detecting a disease. Also notice that not always the whole process from raw data to model training and model evaluation need to be completed, Delta-p statistics can also be used to re-evaluate the coefficients of a previously trained logistic regression model.
Delta-p statistics can only be used to assess the individual effects of predictor columns in a logistic regression model. Logistic regression might not be the best choice when working with high dimensional data, with many correlated predictor columns, and columns not correlated with the target column. The target classes also need to be linearly separable in the feature space.
If you want to replicate the procedure described in the article, one option is to install the open source KNIME Analytics Platform on their laptops and download the KNIME workflow attached to the article for free. A visual representation of the workflow is available on the KNIME Hub without installing KNIME Analytics Platform. Other options are to implement the calculations in any another programming tool, or even perform them manually with a calculator.
As first published in InfoQ.