
In an increasingly digitized world, with continuously growing data volumes, traditional (Lean) Six Sigma process improvement methods are reaching their limits. This is mostly keenly felt in the manufacturing industry. What a “normal” company collects in data in one year, is now collected in manufacturing in one second.
Process improvement experts and data quality engineers simply aren’t able to use the amount of data they could be using. It’s not a surprise that Six Sigma and LSS belts subsequently name “increasing complexity” and “poor data” as the top limitations causing high failure rates to DMAIC projects. Moreover, (Lean) Six Sigma projects take too much time to achieve measurable results – and time is critical in our fast moving world.
Manufacturers stand to benefit hugely from tools that can automate data collection from different systems and provide processed, quality data to a single data source. With access to data-driven technologies, (Lean) Six Sigma experts could be revealing insight currently not visible via conventional methods and tools.
In the following use cases, we show how data mining techniques can help Six Sigma Belts overcome the current limitations they face: increasing complexity and poor quality data.
Handle complexity: Pinpoint parameters with biggest impact
In our first use case we integrated KNIME Analytics Platform into a DMAIC project. The DMAIC project was designed to reduce the chip formation that occurs during drilling of edge connectors for printed circuit boards.
Chip formation during drilling causes 7% of defects. The goal was to reduce defects to 3% or less and gain a potential benefit of EUR 150k p.a.
The challenge here was the complexity of dealing with a large number of process parameters – 100. With traditional tools it would be very difficult to pinpoint which parameters have the biggest impact on chip formation. Using a standard data mining technique, identifying these parameters is much simpler.
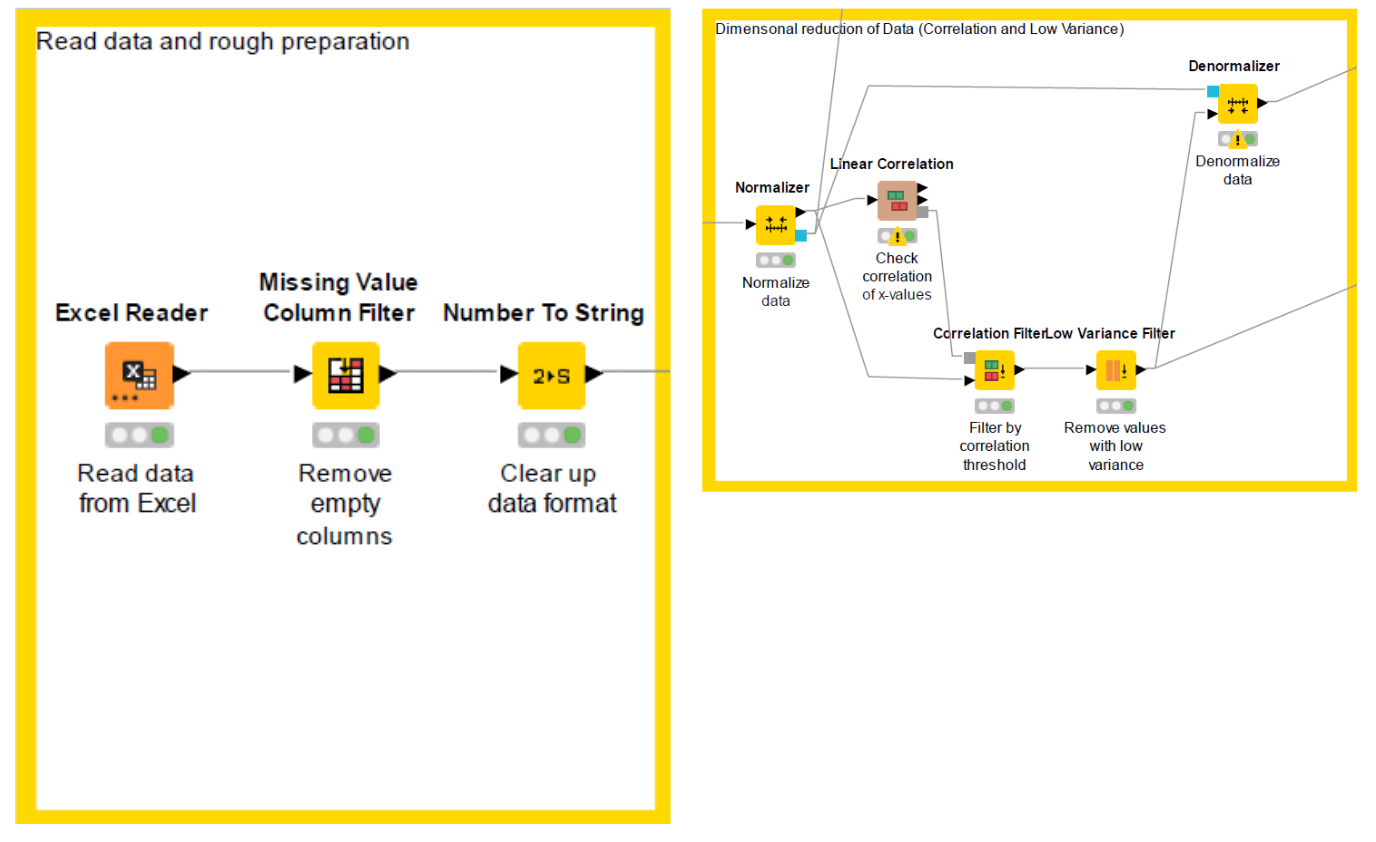
The output of the drilling process is measured automatically by a camera system. The KNIME workflow takes data from the camera system. Each so-called “node” in the workflow performs calculations based on certain algorithms.
Below, you can see how the data are read in and prepared (left) and then a correlation matrix is produced (right), allowing us to identify the relevant parameters quickly and dismiss the rest. Root cause analysis is handled in the workflow by a decision tree: a hierarchical structure of input variables in terms of influence on the process output.
We were able to quickly identify the five machines with the strongest influence on chip formation plus the combinations of variable settings that lead to more chip formation. This information now enables the team to choose the ideal settings to avoid chip formation and defective parts.
Using this information, the team has generated improvement solutions based on effectiveness, ease of implementation, and cost. Now, following implementation, chip formation is 2.7% in comparison to 6.8% before. In the Control phase of the project the team introduced monitoring chip formation with a control chart to sustain the improvement result.
Overall the project has delivered a benefit of €75k with no additional investment being necessary. By using KNIME’s data preparation functionalities and analytics techniques we were able to overcome the complexity and quickly complete the project.
From 30 data points to 5 million data points
In traditional Six Sigma projects, we normally base our analysis on around 30-50 data points. This low number is often due to the fact that we frequently still collect data manually. The paucity of data is another Lean Six Sigma limitation: Without sufficient data, the conclusions we draw from statistical tests might not be reliable. Plus, copying and pasting data into statistics tools is a tedious and error prone exercise.
Digital technologies associated with Industry 4.0, such as cyber-physical systems, cloud computing etc. have enabled vast amounts of data to be automatically generated and collected. Through digital transformation we are shifting to another extreme: We have big data. This shift presents new challenges that we must meet, and this will require a paradigm change. In our second use case, we reveal why.
Improve error recognition with big data analytics
Our second use case involved improving a welding process. Our DMAIC project was set up to improve the recognition of errors in real time that occur during welding.
Four welding machines generate data that are collected by sensors. The amount of data they create is huge: five million data points within minutes. Traditional statistical tools would be completely overwhelmed by this amount of data, processing is slow, and they often cannot handle the complexity of causes and effects.
Therefore, we needed data science techniques – in this case machine learning techniques to enable us to handle the amount of data easily. The data science part of this project followed the CRISP-DM (Cross Industry Standard for Data Mining) model, with the objective of developing and deploying a machine learning model.
Collecting data through machines and feeding it into a data science tool means there are no limits on the amount of data we can read into our analysis, and almost no limit on data formats.
And we already gained huge time savings no longer having to copy and paste into Excel!
Big data analytics – machine learning model verifies data quality
We wanted to verify whether the data provided by the welding machines were reliable. Normally, data science projects do not pay much attention to data trustworthiness: Data quality is rather assessed based on semantic criteria (data format, missing data etc.). However, data quality verification is an important part of the Six Sigma approach.
Now, with access to five million data points for the most influential input variable, we wanted to apply a traditional (Lean) Six Sigma tool, Measurement System Analysis, to assess the data quality. Typically we depend on the probability value (p-value) calculated using ANOVA (Analysis of Variances). However, with this amount of data, our ANOVA calculation always returned a p-value of close to 0.
It would seem that the p-value becomes obsolete when you are working with big data. So, we had to think of an alternative way to test the data.
We developed an artificial neural network (4096 nodes) to predict welding current values for the four machines and took 250,000 datasets per machine, so 1 million in total.
To evaluate the data quality, we introduced a data quality metric based on the Mean Absolute Error. MAE measures the magnitude of errors for an entire group of predictions by averaging the absolute errors for each comparison. It is broadly used in machine learning to assess the prediction accuracy of a model.
The result is as follows:
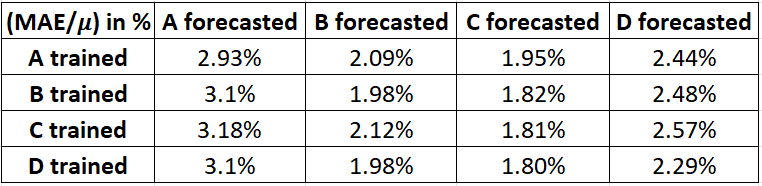
The error in relation to the actual mean value was only between 2 and 3 percent for each comparison. This clearly indicated that our machine data could be trusted.
Tip: Read the full paper 'LSS4.0 - Creating Opportunities to existing Limitations' by Tanawadee Pongboonchai-Empl, Dr. Dietmar Stemann, Prof. Jiju Antony Proceedings of the 8th International Conference on Lean Six Sigma (2021, June).
DMAIC project success rate improves with access to data-driven technologies
By enhancing DMAIC projects with KNIME we were able to use significantly more data in our analysis and gain information that enabled the data teams to set up improvement solutions that save the company money, with minimal investment.
The low-code environment made it easy for us to learn to apply this data science solution. It took us about six hours to build the KNIME workflow for the first use case; alone the time saved no longer copying and pasting between Excel and Minitab was phenomenal.
Try the free, open source KNIME Analytics Platform yourself. Download KNIME.
About DIY Digitalization
DIY Digitalization elevates Six Sigma to the next evolutionary level, empowering your teams to solve problems faster and improve processes with scalable impact by harnessing the power of data analytics.