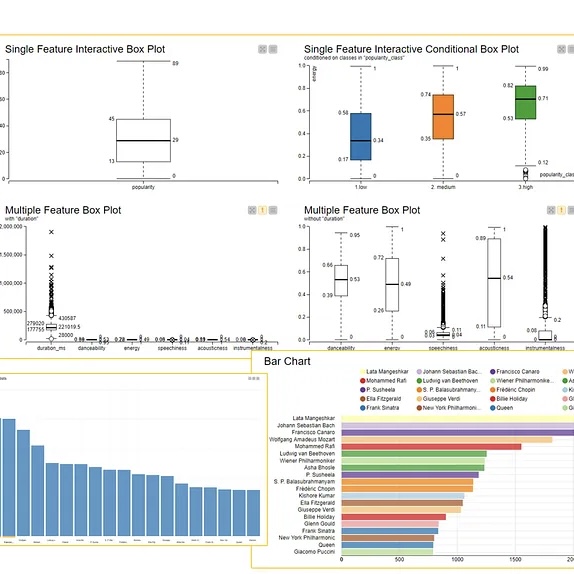
Here at KNIME, we’ve set out a #66daysofdata roadmap. Follow it to learn about data preparation, blending, and visualization. Every day @DMR_Rosaria (on Twitter) and Roberto Cadili (LinkedIn) will share a daily task on Twitter and LinkedIn with links to further resources.
The idea is to spend around 5-10 minutes on a specific data science project each day for 66 days and share your progress on your favorite social media platform with #66daysofdata. Ken Jee is the original instigator of #66daysofdata. Why 66 days? Because that's the average time it takes us to get practiced at doing something. In this case, data science with KNIME.
New to KNIME?
Our tool of choice for the project is KNIME Analytics Platform (v. 4.4.1). It’s open source and accessible to anyone. Download and start using right away.
KNIME Forum for your questions along the way
If you have questions about using KNIME, or any of the data science techniques in our roadmap, head over to the KNIME Forum. Use this thread especially for the #66daysofdata. There’s a really active community on the Forum, happy to help answer your questions!
If you don’t already have a Forum account, it’s easy to set one up on the Login page.
Share Your Progress on KNIME Hub and Social Media
Store your work on the KNIME Hub, and share your progress by posting an impression of your workflow or visualization on social media (e.g., Twitter, LinkedIn, etc.) with the hashtags #KNIME and #66daysofdata.
Celebrate Your Project with a Digital Badge
After completing the challenge, send the link to your work on the KNIME Hub to blog@knime.com, and earn a celebratory digital badge of the #66daysofdata challenge with KNIME that you will be able to share on social media.
Explore the Datasets—Musicians, Tracks, Danceability
The core of this project relies on three Spotify datasets freely available on Kaggle (sign in to download them). The Kaggle descriptions don't provide too much information about the different columns, you can check out an overview of column names and descriptions for each dataset on this article page.
Note.
The tracks.csv dataset contains about 600k tracks from the period 1900-2021 and is described by 20 columns
The artist-uris.csv dataset contains data on roughly 81k artists and is described by 2 columns (header names are not provided)
The artist.csv dataset is very similar to the tracks.csv dataset but also includes a popularity metric for the artists.
