
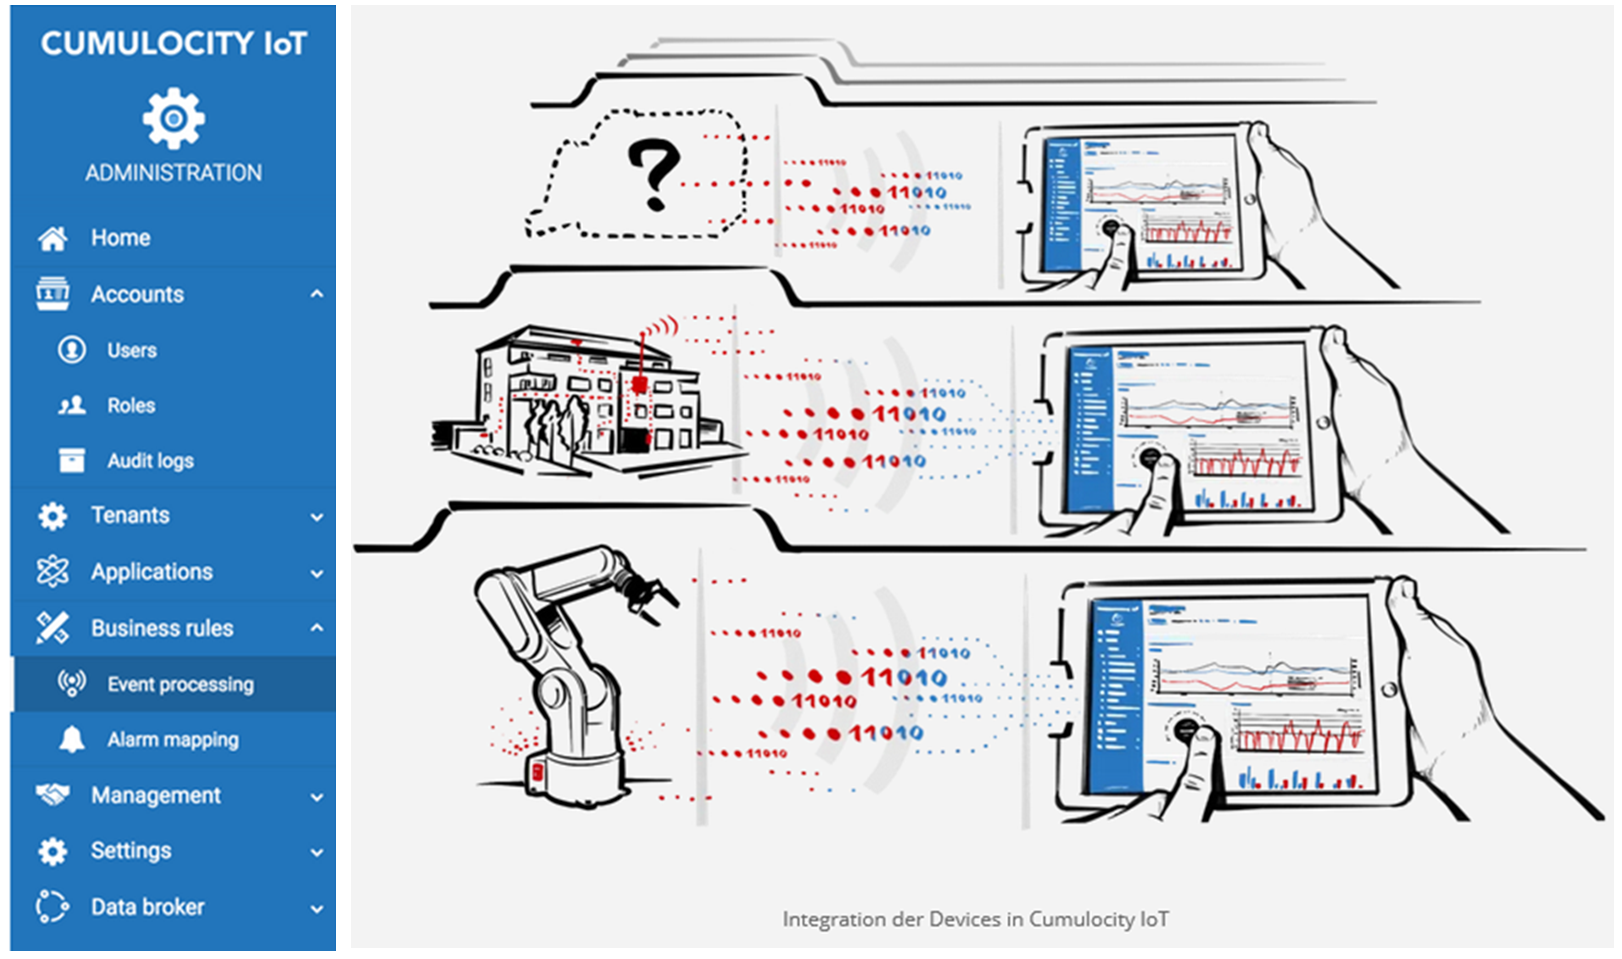
Today, all of our digital devices and sensors are interconnected in the Internet of Things. tarent has built an extension for KNIME Analytics Platform that enables you to connect to Software AG’s Cumulocity Iot platform so that you can use the more advanced analytics provided by KNIME on your Cumulocity data.
The concept behind the Cumulocity platform is to keep IoT projects simple with a single architecture, simplifying industrial equipment connections, and no coding required. It connects and manages your devices and assets and can control them remotely.
Thanks to the multitude of certified devices and available SDKs for the development of own device agents, interfacing with the platform is easily accomplished. The integrated web application framework allows easy entry into modern multi-platform visualization options thus catering to a wide variety of audiences, such as device managers, administrators, and business users.
Cumulocity enables you to perform certain analytics operations on your data, but with the new KNIME Analytics Platform Cumulocity Extension you can perform more complex analyses, including machine learning operations, you can analyze multiple devices and also integrate data from a variety of other sources.
In this article we would like to show you a workflow that demonstrates the Cumulocity nodes. Our example is based on a bike share system in Washington DC called Capital Bikeshare. Each Capital Bikeshare bike is fitted with a sensor which sends the current check-in and check-out times of the individual bikes to a central repository. All historical data have been made available for download on Capital Bikeshare’s website. These public data have been downloaded and used for this study.
Introducing - the Cumulocity Connector Extension
The nodes in this community extension provide functionality to retrieve information about IoT devices, corresponding measurements, alarms and events from a given Cumulocity IoT platform instance. These data, possibly in combination with any other data, can be used to create new events and alarms within KNIME and write them back to Cumulocity in order to trigger the corresponding actions within Cumulocity.
- You can access and download the Cumulocity Connector Extension from the KNME Hub

The KNIME Workflow
The purpose of this demo workflow that combines Cumulocity with KNIME is primarily to demonstrate how to use the Cumulocity nodes. They have been integrated into an existing workflow, which visualizes, analyzes and makes predictions for restocking the bike stations managed by Capital Bikeshare.
Capital Bikeshare offers a download of their bike usage data dating as far back as 2010. They also offer a live REST-API. In this workflow, we use data from 2018 and 2019 as training data and evaluate the learned model on the data of the first three months of 2020.
The task is the same as in the original IoT demo workflow (Taming the Internet of Things) to predict one of three classes, that is whether a bike station needs: to remove bikes, to add bikes, or that no action is required. Predicting three classes is easier than predicting a precise number and classification methods can be used. We only use the data that was provided by capital bikeshare (with some assumptions on the initial status of the stations at the end of 2017). The primary purpose of the workflow is to show how KNIME and Cumulocity can be used in concert.
Disclaimer: As the aim of this article is to demonstrate how the Cumulocity extension is used, our focus is therefore not in looking at optimizing the machine learning model; we also do not use any external data. A natural extension of this workflow would be for example to join weather data to the device data in order to improve the prediction quality or to use more advanced time series analysis methods for the machine learning part.
We don’t know which system Capital Bikeshare uses to manage their stations and bikes, but let’s assume that they use Cumulocity and that their devices continuously report their status to their instance of Cumulocity. There are many possible setups for this scenario, but we will assume a very simple configuration: each station represents a single device and whenever a user picks up from or returns a bike to a station an event is triggered for that respective station. We know that this is a grossly simplified setup, but it will suffice for our demo purpose.
To facilitate this setup, we converted the downloadable data into a format that can be loaded into Cumulocity. To speed things up a little bit further we also aggregated all events on an hourly basis before loading them into Cumulocity. In a real setup, each event would be written live to the database.
We ended up with data from 584 bike stations and between 90 and over 15,000 events for each station for a total of nearly 3.7 million events for our observation period of 27 months.
Let’s now look at the different parts of the workflow:
Step 1: Read station info
The very first step is to define the connection settings for the Cumulocity connector and to retrieve information about the known devices. The device retriever simply retrieves basic information about all accessible devices, we therefore filter for all ‘bike station’ devices. The downloadable data does unfortunately not provide any information about how many docks are currently occupied at each station. We simply assume that all stations are at 80% of their maximal capacity at the end of 2017 which is our initial ‘load ratio’.
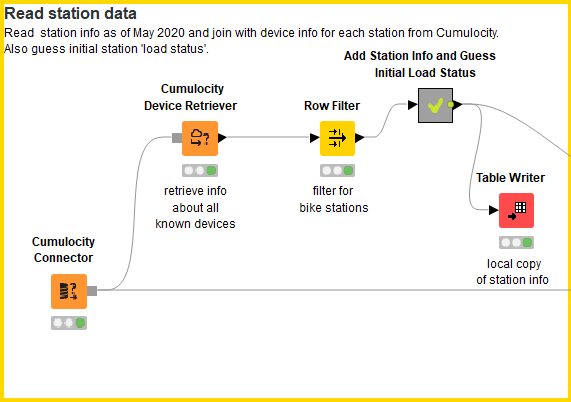
Figure 1: The part of the workflow that connects with Cumulocity and retrieves the data from each bike station.
Step 2: Iterate over the known stations and add time series information to each event
We assume total independence of all stations and events. We can thus create the training data for each station regardless of what happens at the other stations. The ‘Events Retriever’ node gives us a number of options to restrict the amount of events that is retrieved:
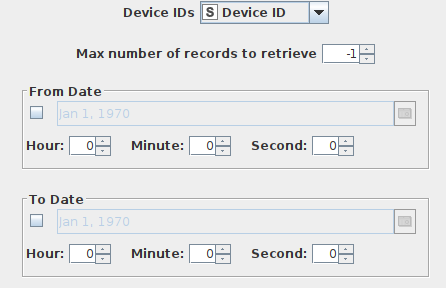
Figure 2: The configuration dialog for the Events Retriever node.
We will however only set the parameter ‘Device IDs’ and retrieve at each step of the loop all events for a single device. We then use the ‘Lag Column’ node on the ‘load ratio’ column to create a simple time series: we add to each hourly record the load ratio of the station for the last 10 hours. We then look one hour into the future to add the target variable: do we need to add or remove bikes or is no action required?
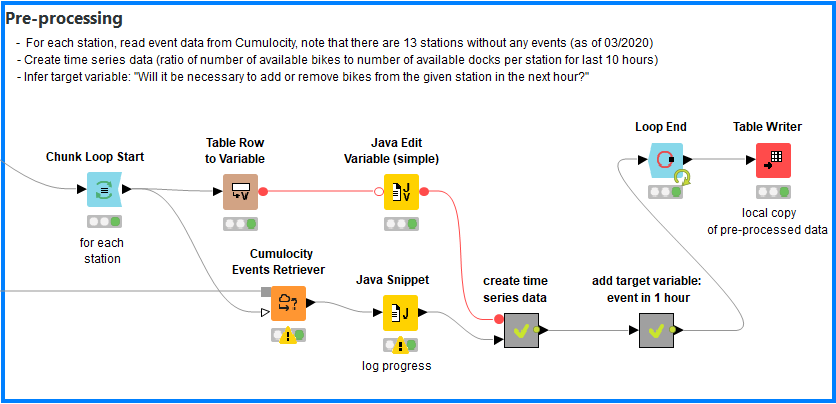
Figure 3: Preprocessing: event data is read from Cumulocity; time series data are created, and a target variable is inferred: will it be necessary to add or remove bikes from the given station in the next hour?
Naturally, this would be the point to add external data such as information about whether the current day is a workday or a holiday, what are the current weather conditions or possibly other measurements that are retrieved from Cumulocity from other devices.
Step 3: Visualizations
KNIME offers a huge variety of visualization methods. We added a few just to get a feeling for the data. Figure 3 shows a cross-correlation matrix for a single station. It shows that the respective ‘load ratio’ features are highly correlated - as one would expect.
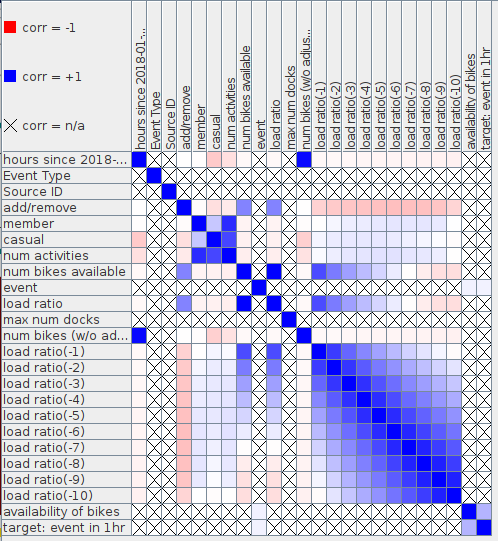
Figure 4: Cross-correlation matrix for the values for Station ‘10th & E St NW’.
Step 4: Machine Learning
We move on to the actual machine learning part of the workflow once we have explored the data and are satisfied that the pre-processing produced correct results. When we look at the distribution of the target variable we realize that our data set is highly imbalanced. In over 90% of the cases, no action is taken which is not surprising, but poses a problem for most machine learning methods. We simply remove ‘boring events’ to get a slightly more balanced distribution. 'Boring' events are those where no bikes are added or removed and the current load ratio is between 0.1 and 0.9. The following steps are standard (Figure 4): Split the data into a training and a hold-out data set and evaluate the learned model(s) on the hold-out set.
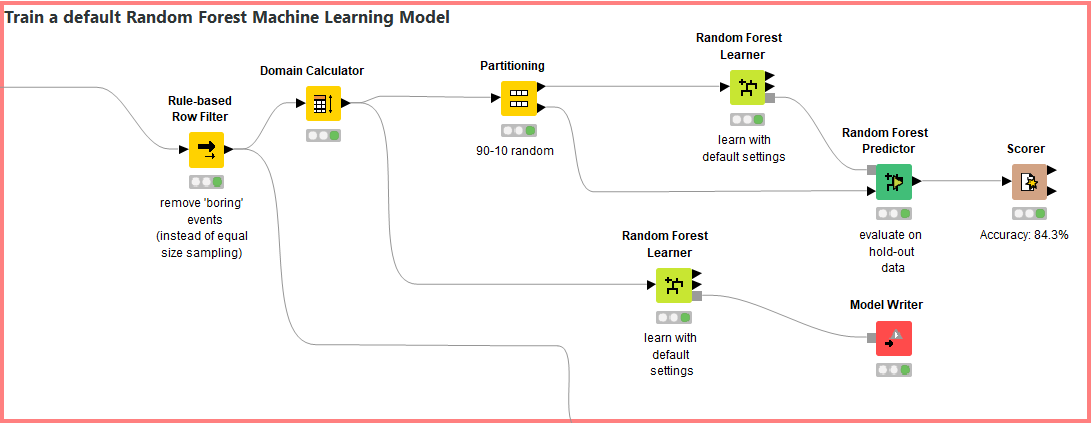
Figure 5: A very basic machine learning setup
We see that the performance on the hold-out dataset is quite all right, but again - in a production setting we would put more effort into this part of the workflow and most likely try something like recurrent neural networks on this time series data.
Step 5: Write back alarms to Cumulocity
The final part of the workflow shows how we can use a previously learned model to raise alarms in Cumulocity. Remember that our target variable was to predict when bikes need to be added or removed from stations within the upcoming hour. So whenever such an event is predicted, we raise an alarm so that Cumulocity can trigger the process of restocking for the respective station where the alarm was raised.
Figure 5 shows how we retrieve the raw data from Cumulocity, pre-process it in the same manner as the training data and then apply the learned model to it. The part where we raise the alarms is quite simple: whenever the model predicts a restocking event, then we raise an alarm. Please note that this still assumes independence of events which is of course not true. In reality, we would run this part of the workflow at least once every hour on the data that had changed since the last run. Using that setup, the restocking event would be reflected in the data when the workflow is run the next time and the updated load ratios would be taken into consideration when the model is applied to the new data.
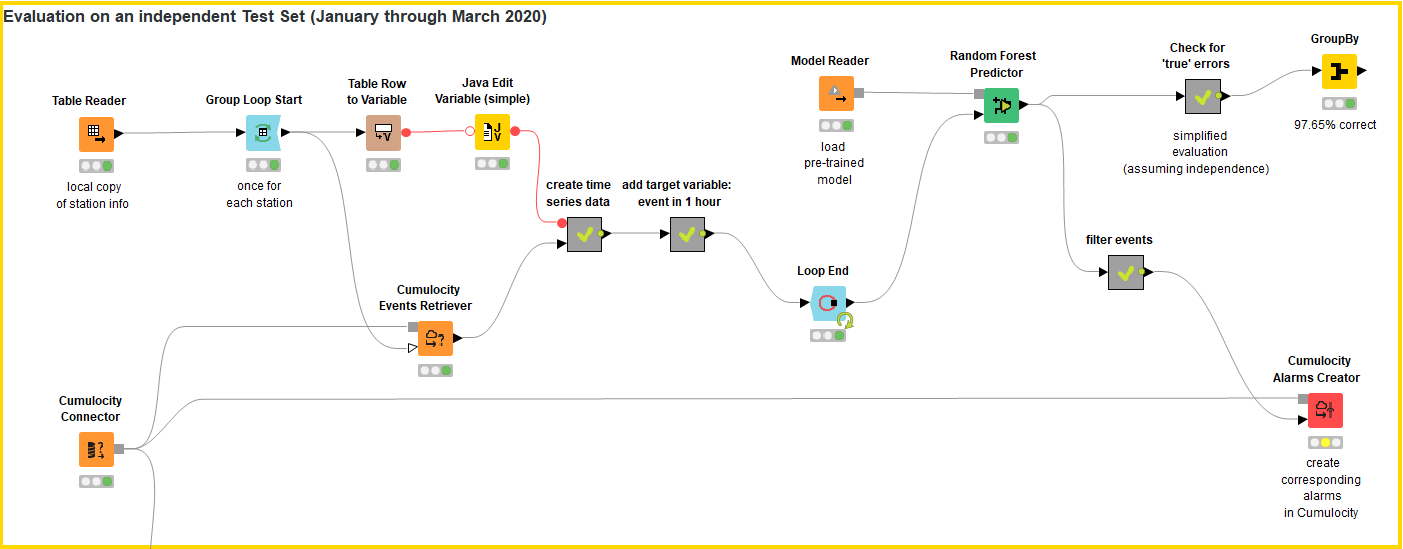
Figure 6: Evaluation of the learned RF-model on independent data
Conclusion
We created a very simple restocking alert system that triggers an alarm in Cumulocity whenever a station is about to run out of bikes or is close to overstocking. We have shown only a tiny part of the capabilities of either system - KNIME or Cumulocity, since our aim was to show how these tools can be employed in concert. The open source Cumulocity Connector extension for KNIME is available from KNIME 4.1 on and can be installed like any other KNIME extension either by drag&drop from the KNIME Hub or via the File menu in KNIME.
The Cumulocity Connector extension is located on the Community Extensions (Experimental) site. If this site isn’t already enabled as an available software site, go to the File menu and select Preferences. Now click “Install/Update” -> “Available Software Sites” and select KNIME Community Extensions (Experimental) from the list that appears.
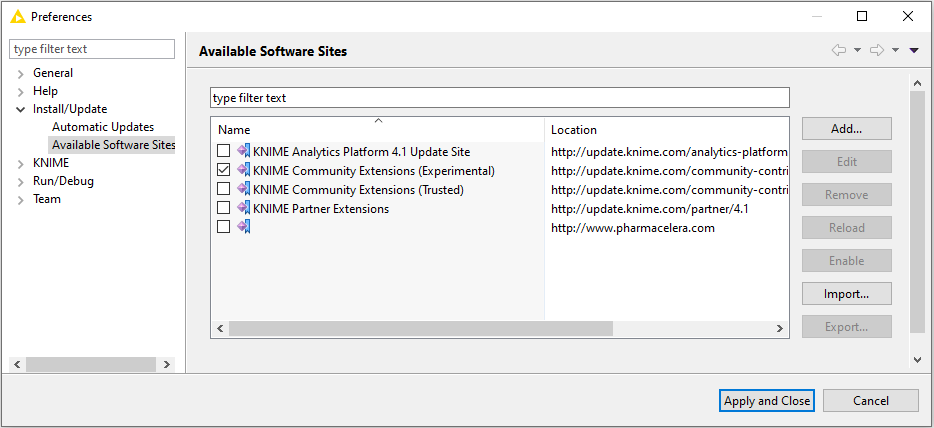
Figure 7. The “Available Software Sites” dialog. Click KNIME Community Extensions (Experimental) to access the Cumulocity extension.