One of the main tasks of the finance department is to prepare the budget overview.
At the beginning of the year budgets are created for the various products/divisions/departments/projects to last the whole year. Money is assigned according to budgets at the beginning of the year, spent during the year, and throughout the year the finance department must make sure that money spent does not exceed money assigned.
Let's look at how to calculate it in KNIME and have a reusable solution that you can use next year, too.
The video gives you an overview of budget monitoring with KNIME and the rest of the article walks you through how we built the workflow.
The task: Budget monitoring
The calculation is easy and deals with:
- Money assigned: A lump sum of money established for a project/department/… at the beginning of the year
- Money used: The sum of the expenses throughout the year
- Money remaining: The difference between the money assigned and the money spent at each point in time.
It's important to visualize budget monitoring to see identify where things are going well (or not). Here are ideas for three possible visualizations.
- Total budget overview (total money assigned, total money used, and total money remaining) across all projects
- Single budget overview for each project. If there was a minus in the budget management, which project/department was responsible for it? In general, even in more favorable conditions, it is useful to know how the budget management went for the different projects.
- Another interesting overview refers to the trends over time. Has the total assigned budget been reduced across the years? Has budget management improved over time, i.e. years, months, quarters?
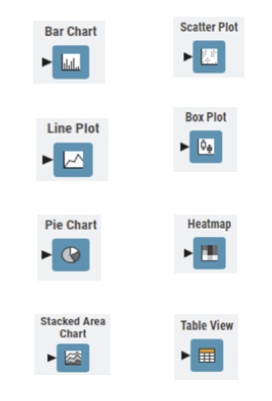
KNIME offers the ability to create many different kinds of visualizations.
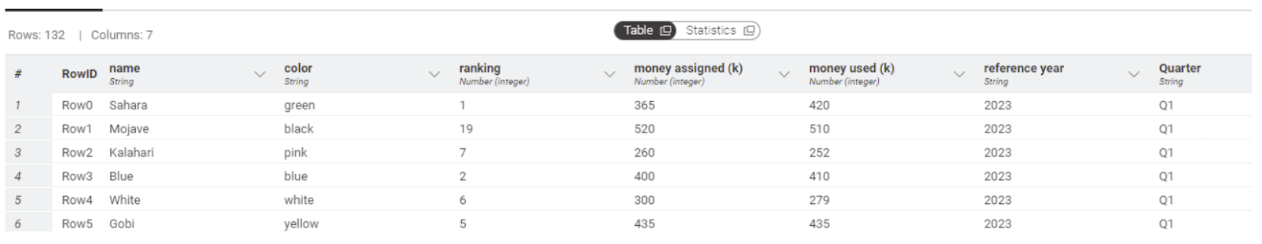
Let’s take an example with 11 projects, identified by desert names and running across three years, from 2021 to 2023. For each project, we will import from our accounting system the money initially assigned and the total money used throughout each year. See an example in figure 1, where money is expressed in 1000 units.
The workflow: Budget monitoring report
The workflow Budget Monitoring Report for this use case is available and free to download from the KNIME Community Hub and includes the following steps:
- Read budget data - money assigned and money used for each project - from an ERP system, an Excel file, or a CSV file with the appropriate reader node. In our example, we used a CSV file and a File Reader node.
- Calculate the remaining money as (money assigned – money used) for each project
- Visualize the data
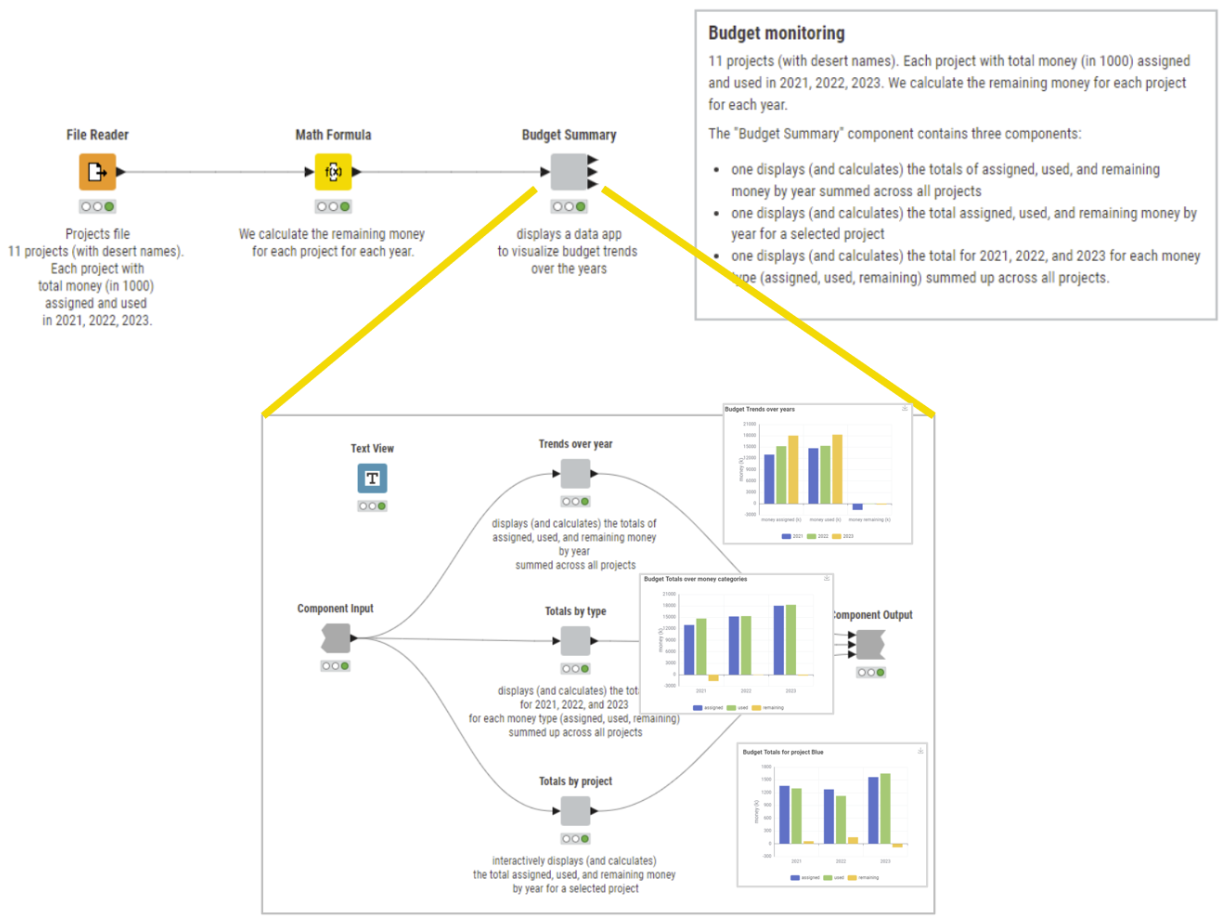
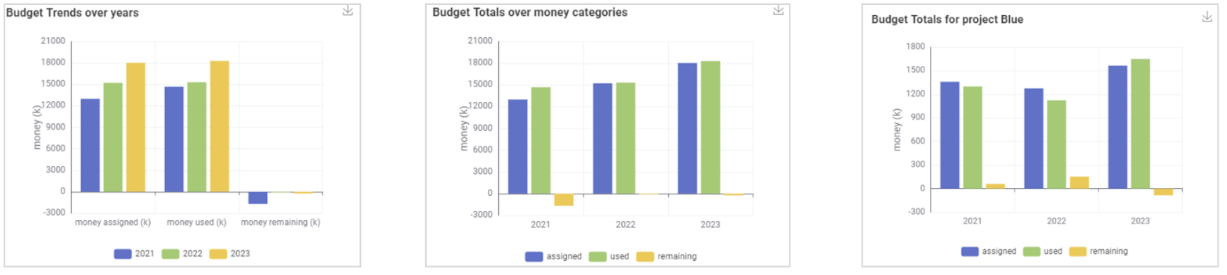
To visualize the data, we chose the following three options:
- The trends across years for money assigned, money used, and remaining money (left)
- The total amounts for all projects year after year (center)
- The total amounts for a single project year after year (right). For this chart we added one control item for project selection.
The results: Budget monitoring in a live data app
Let’s have a look at the results on the live data app (see the gif below).
In the first bar chart (top left), we see that the budget amount assigned to projects in total has grown considerably year after year, and so has grown the amount used.
In the second chart (top right), we see that in the first year (2021), there has been a miscalculation about the money effectively needed for the various projects and therefore there was a negative amount in the difference between assigned money and used money. The finance department has probably learned from that experience and assigned more money to some projects in the upcoming years.
Finally in the lower part of the data app, we can observe the budget balance of each single project across the years. For example, which project was responsible for the negative amount of remaining money in 2021? By selecting a different project in the box on the left, we can see the balance situation in the bar chart on the right. While project Blue, White, Kara Kum have been quite virtuous in spending the budget money in 2021, not the same can be said for the other projects. Most of them, however, have learned over the next two years and asked for and used a proper budget.
KNIME for Finance
The intuitive low-code environment of KNIME Analytics Platform enables non-technical users to get started easily with data science and benefit from techniques that enable you to automate repetitive tasks, reduce human error, and expedite reporting. Explore more use cases for Finance, Accounting, and Audit on KNIME Community Hub.