
Travel Risk Guide for Corporate Safety with Amazon AI Services
Due to the increasing internationalization of business, more and more employees are becoming globally mobile. Providing reliable information and protecting workers abroad in terms of health, safety, and security is the employer’s duty. As we write, travel has been restricted severely to help prevent the spread of COVID-19. Organizations are needing to tightly monitor the constantly evolving situation. Before business trips can be planned, it's necessary to check the status. Our travel safety guide can help!
Takeaway: In this article we show you how we built it and focus on how to use the KNIME Amazon Machine Learning integration with Amazon AI Services to translate the news, determine sentiment, and extract key phrases.
Download the KNIME Amazon Machine Learning Integration from the KNIME Hub.
Topic. Show travel risk information in a choropleth world map. Translate, extract key phrases, and determine the sentiments of the local news in one country.
Challenge. Visualize numeric information assigned to country names in a choropleth map based on Google Charts and JQuery library. Perform natural language processing tasks using Amazon AI Services integrated in KNIME Analytics Platform.
Access Mode / Integrated Tool. RSS feed, Google Charts, Amazon AI Services
The travel guide consists of two parts.
- An interactive travel risk map to show the risk level in all countries as estimated by the U.S. Department of State. The map is a choropleth world map based on Google Charts and JQuery library, easy to build with this Choropleth World Map component. The travel advisory information is retrieved via the RSS feed of the U.S. Department of State - Bureau of Consular Affairs web page
- An interactive dashboard that shows the general atmosphere in one country by
- a tag cloud with the key phrases in the news and
- a table with news extracts and their sentiments
Visualizing travel risks in a choropleth map based on Google Charts
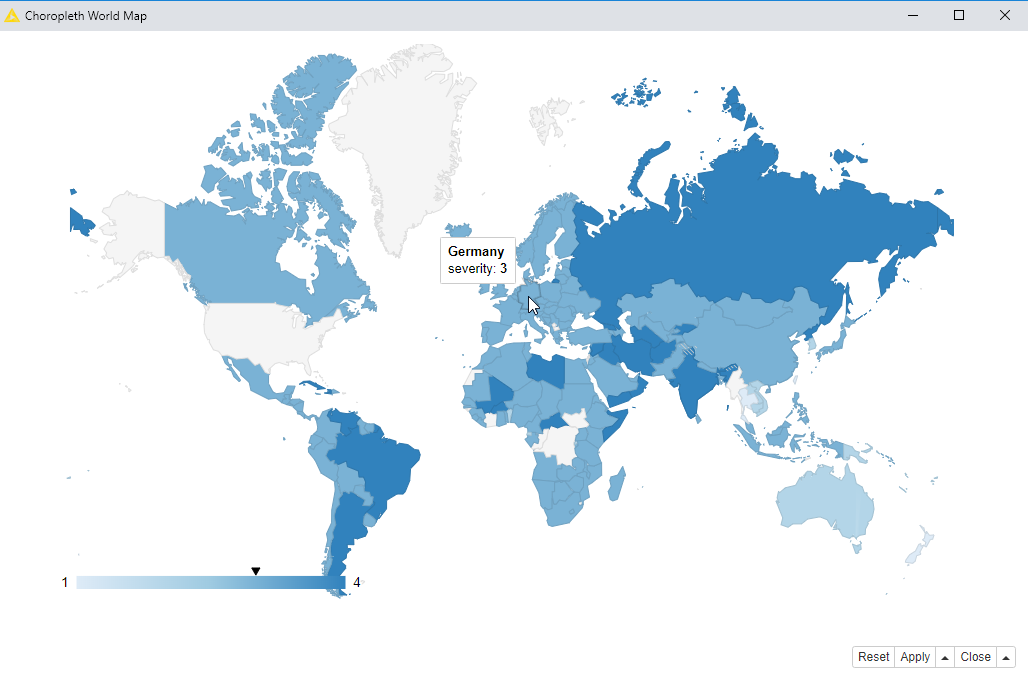
The choropleth map shows the travel risk levels for each country as estimated by the U.S. Department of State. The travel advisories are provided as short sentences, for example, "Iceland - Level 1: Exercise Normal Precautions". We extract the numeric risk levels (from level 1 "Exercise Normal Precautions" to level 4 “Do Not Travel”) and country names into separate columns, and use these columns to build the Choropleth world map. These steps make the first part of the workflow in Figure 2. The Travel Risk Map workflow is available on the KNIME Hub.

You can download the workflow Travel Risk Map for Corporate Safety using AWS Comprehend and Translate from the KNIME Hub.
- Inside the “RSS Feed Extractor” metanode we access the travel advisories of the U.S. Department of State with the RSS Feed Reader node. The information for each country is provided in a separate document.
- Inside the “Preprocessing - Safety Map” metanode, we separate the country names and risk levels from the documents, and manipulate some country names so that they match the country names that are used to build the choropleth map.
- Next, we use the Choropleth World Map component to visualize the risk level in each country (Figure 3). The Choropleth World Map component is available on the KNIME Hub.
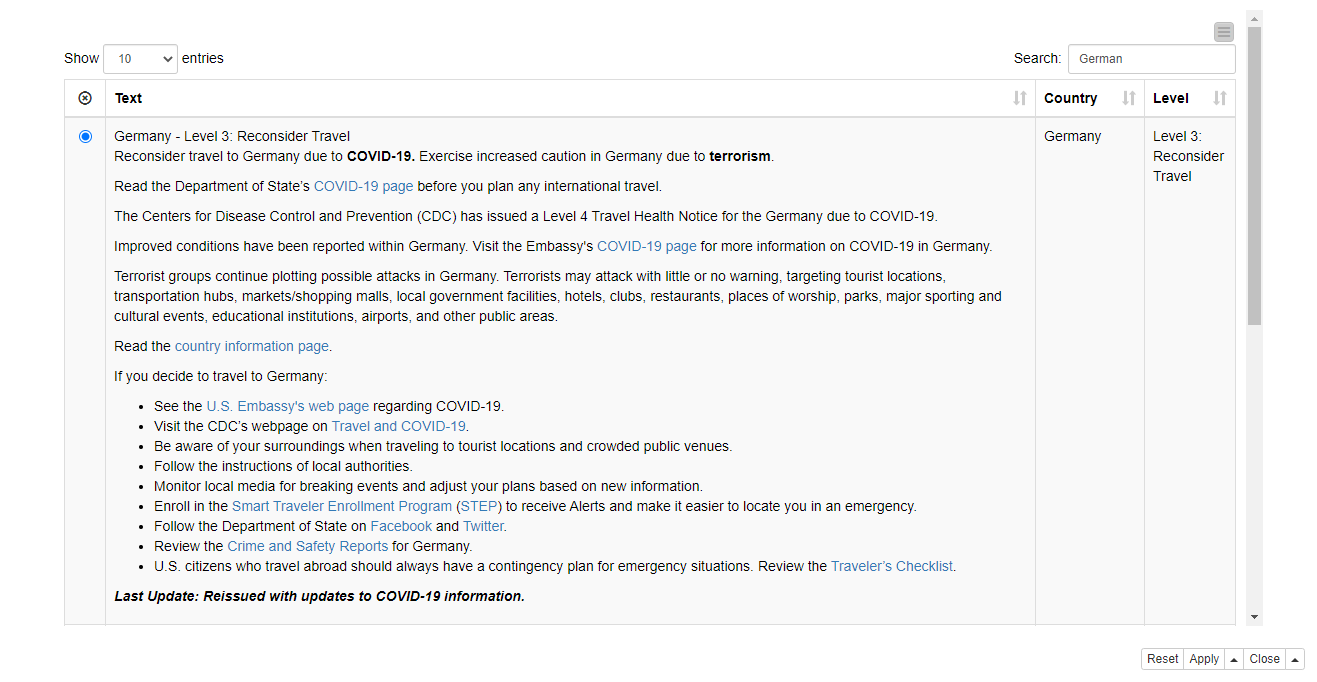
- As a last step in the first part of our travel safety guide, we use the Table View node that displays travel advisory information about each country in an interactive table, and allows for selecting one or multiple countries for further analysis. We select the country of our interest, in our case Germany (Figure 4).
Translating, extracting keywords, and analyzing the sentiment of local news with Amazon AI Services
Now that we have obtained the global picture, we want to analyze Germany in more detail. What are people talking about? Are they optimistic, or rather scared? Of course, we’re not going to bother us with strange words that go beyond “Berlin”, but let Amazon AI Services translate the local news for us. These steps are covered in the second half of the workflow in Figure 2.
We start by retrieving some German news via the RSS feed of two providers, ntv and t-online. Next, we use Amazon AI Services to determine the dominant language of the retrieved documents, translate them into English, and determine their sentiment positive/negative/mixed/neutral. Finally, we extract the key phrases from the documents. All these steps can be performed with nodes that are part of the KNIME Amazon Machine Learning Integration, all with graphical user interfaces.
Amazon Web Services and KNIME Amazon Machine Learning Integration
Amazon Web Services (AWS) cloud platform provides services for several machine learning (ML) and artificial intelligence (AI) capabilities. KNIME Analytics Platform integrates various AWS services, and here we use two of them, Comprehend for ML based natural language processing and Translate for neural machine translation of text from a source to a target language. You can install the KNIME Amazon Machine Learning Integration from the KNIME Hub.
- Connecting to AWS: Amazon AI services is a paid service, and all Amazon Web Services nodes require an AWS connection. Therefore, we start with the Amazon Authentication node. We provide the authentication with, for example, an access key ID and secret key. We can get these credentials if we login to the AWS Management Console, and select “My Security Credentials” in the user menu in the top right corner. On the page that opens, we click “Create access key”, and make sure to save the secret key, which can’t be retrieved afterwards. In the configuration dialog of the Amazon Authentication node, we check the “Access Key ID and Secret Key” option, and enter the credentials in the fields that activate. Once the authentication has been provided, we can check “Switch Role”, and enter the account ID and the desired role that has been granted some specific permissions.
- Using nodes in the KNIME Amazon Machine Learning integration: Next, we perform a number of natural language processing tasks (Figure 5). The key nodes here are
- Amazon Comprehend (Dominant Language) that takes a document column as input and shows its dominant language in a separate column in the output
- Amazon Translate that takes as input the original document in German (or another source language) and outputs the document translated into English (or another target language) in a string column
- Amazon Comprehend (Sentiment) that takes the translated document as input, and assigns a sentiment into each document, available in a separate column in the node’s output
- Amazon Comprehend (Key Phrases) that extracts the key phrase (a noun and its modifiers) from the input document into a string column
If you’re interested in how to integrate other Amazon Machine Learning capabilities in KNIME Analytics Platform, check out this KNIME and AWS Machine Learning Integration blog post.
Visualizing key phrases in a tag cloud and displaying news extracts with their sentiments
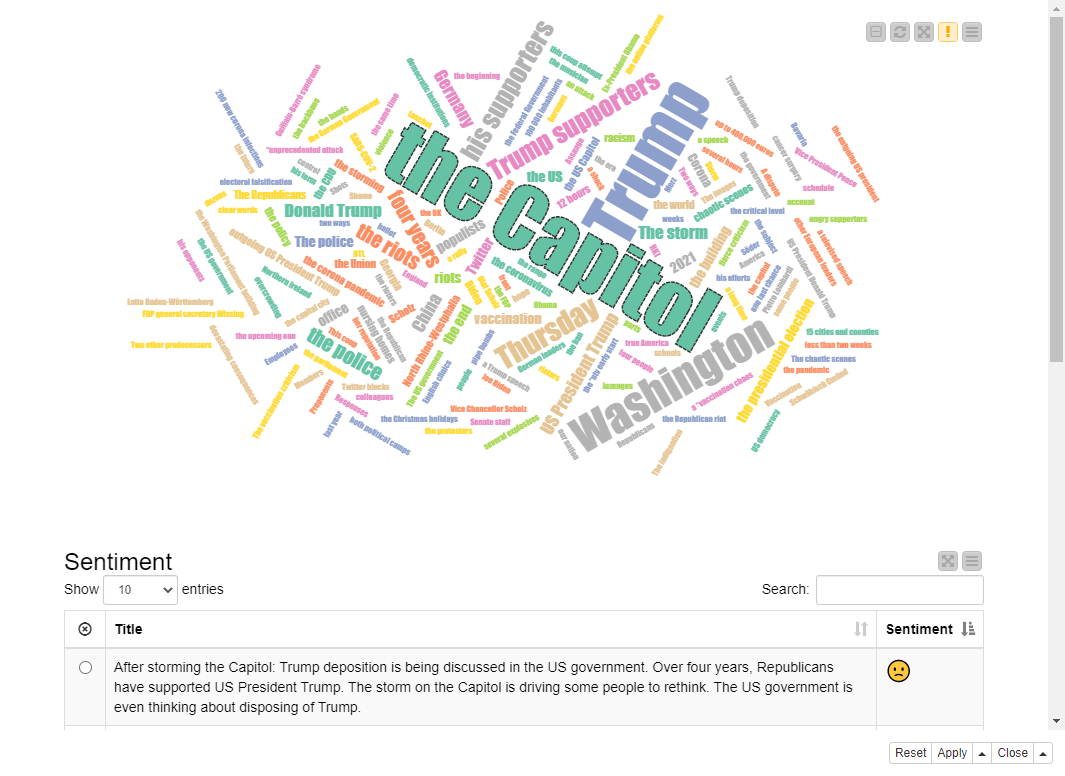
In the last step, we visualize the extracted information in another, interactive dashboard. Inside the “View News from Selected Country” component, we calculate the numbers of occurrences of the different key phrases, and use the count of each phrase to define its size in the tag cloud. We also show a list of translated German news and their sentiments. The result is shown in the interactive view output of the component (Figure 6).
The Results
The final workflow successfully blends together the following:
- Global overview of travel risks, shown on a Google choropleth map
- News alerts for a selected country, translated, with key phrases extracted and sentiments determined using Amazon AI Services