
High throughput biochemical and phenotypic screening (HTS) enables scientists to test thousands of samples simultaneously. Using automation, the effects of thousands of compounds can be evaluated on cultured cells, or using biochemical in vitro assays. The goal of HTS is to be able to identify or “hit” compounds that match certain properties. As HTS is usually conducted on very large libraries of compounds the volume of raw data that is produced is usually huge. This calls for an analysis tool that is able to handle large volumes of data easily.

In our analysis, we have used a platform that supports data science techniques. These techniques are better able to process and assess very large sets of raw data, in comparison to, say, conducting our analysis with a spreadsheet-based tool. The data science tool also enables us to perform more complex operations.
The motivation for this study was to help laboratories assess all kinds of raw data generated from HTS, regardless of whether these data are chemical, genetic, or pharmacological in origin. We wanted to provide a process that enables the analysis of large volumes of data and quick and interactive visualization of the screening results. The data science tool we chose for the analysis and visualization was KNIME Analytics Platform.
Read full article here:
A workflow for high-throughput screening, data analysis, processing, and hit identification
Authors: Catherine S. Hansel1, Schayan Yousefian1, Anna H. Klemm2 and Jordi Carreras-Puigvert1
-
Science for Life Laboratory, Division of Genome Biology, Department of Medical Biochemistry and Biophysics, Karolinska Institute, Stockholm, Sweden
-
Department of Information Technology, Division of Visual Information and Interaction, SciLifeLab BioImage Informatics Facility, Uppsala University, Uppsala, Sweden
Keywords. High-throughput screening, data processing, hit identification
High-throughput biochemical and phenotypic screening (HTS) is a gold standard technique for drug discovery. Using automation, the effects of thousands of compounds can be evaluated on cultured cells, or using biochemical in vitro assays. By doing so, “hit” compounds can be identified that modulate the readout(s) favourably. Since HTS is typically conducted with large compound libraries under several conditions, the raw data generated is often very large and split over a number of spreadsheets/table-like sheets containing data. Therefore, we have created a KNIME workflow to help process and assess large sets of raw data generated from HTS. This workflow automatically imports HTS data and processes it to identify hits with tunable criteria. This means that the user is able to choose different thresholds to identify a compound considered as a hit. Additionally, three commonly used quality control measures, the Z-Prime, signal/background (S/B) and CV, are calculated in the workflow and are visualized in a comprehensive manner.
Helping labs assess raw data from HTS
The motivation for this study is to help laboratories assess the raw data generated from high-throughput screens (HTS), whether they be chemical, genetic, or pharmacological in origin. This workflow focuses on a chemical phenotypic HTS; the aim is to identify small molecules/compounds that alter the phenotype of a cell in a desired manner. It has three blocks: file-upload, data processing and visualization.
In our experiment, the objective is to find hit compounds that rescue the cell death induced by the expression of a deadly protein. The positive control cells do not die, since the deadly protein is not expressed, whereas the negative control cells do die since the deadly protein is expressed. Compounds are added to cells expressing the deadly protein and a hit compound shows greater viability than that of the negative control cells. First the HTS viability data is uploaded and then it is normalized and the compounds’ Z-scores are calculated in the “Normalize” metanode. In this example the data is normalized to the positive control values for visualisation purposes; the data could also have been normalized to the negative control values. In order to find a hit compound one can look at the Z-score of the compounds’ effect on cell viability. The Z-score measures the relationship between a particular compound’s effect on cell viability to the mean effect of all the compounds (since we assume that most compounds have no effect), measured in terms of standard deviations from the mean. A threshold value can be set e.g. a hit compound is defined as any compound that lies two standard deviations above the average cell viability value. Please note that the Z-score should only be used as a hit determinant for the initial screen, for validation screens most compounds are likely to have an effect and therefore the normalised cell viability would be used to determine the hit compounds.
Quality control & visualization of screening results
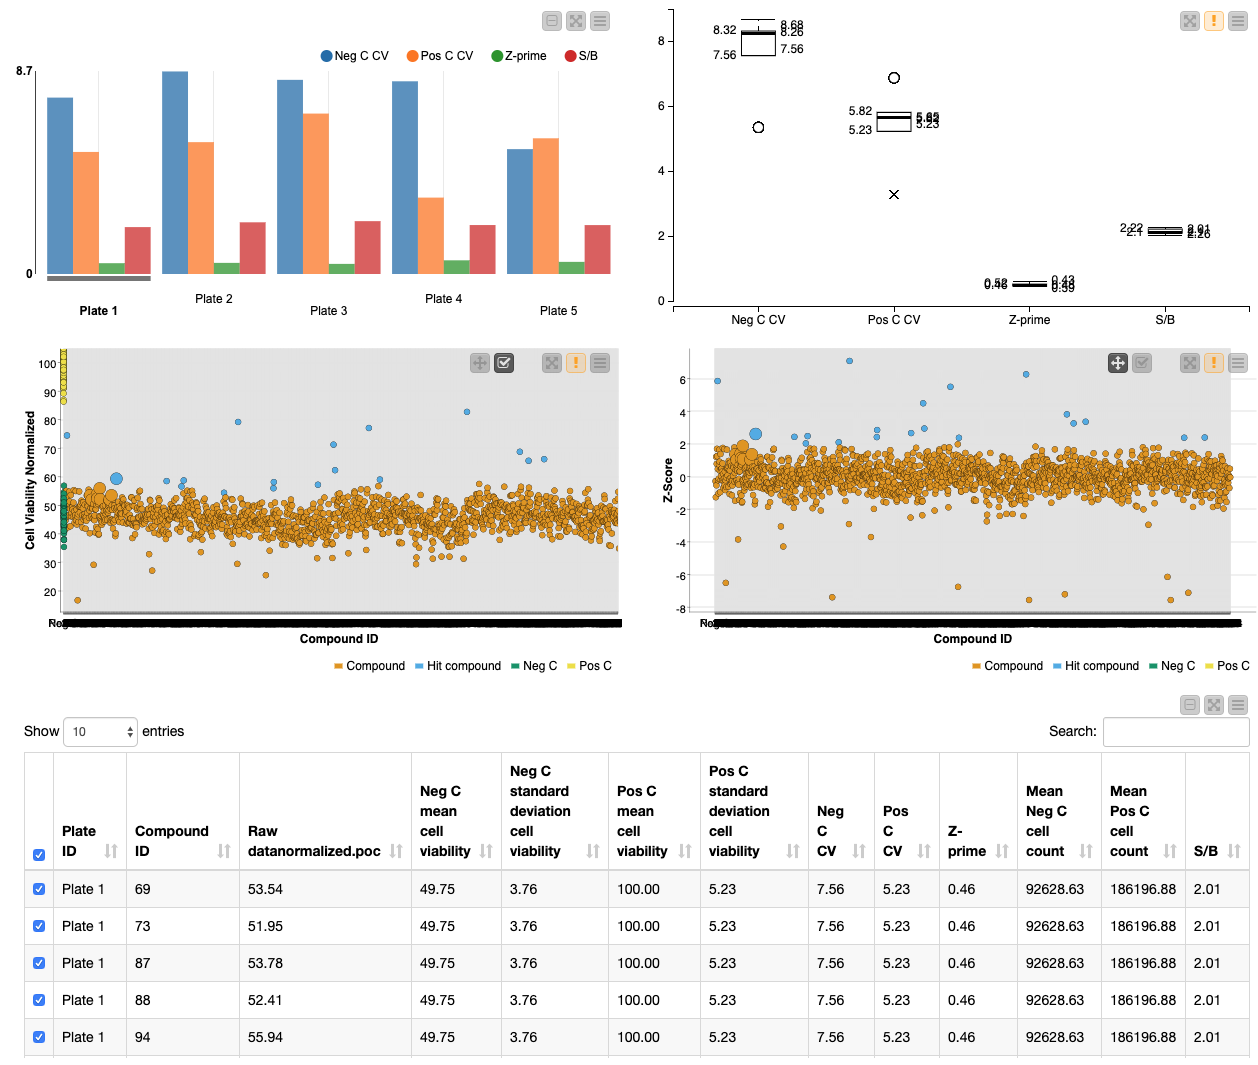
This workflow also allows the user to test the robustness of the HTS by performing quality control calculations in the Quality Control metanode. HTS need to be robust and reliable in order to avoid finding false positives/negatives. Moreover, quality control can highlight flaws in the screening protocol that need to be adapted. In the “Process control data” metanode, quality control is assessed by calculating the coefficient of variation (CV), Z-prime and signal-to-background for the positive and negative controls. The CV measures the dispersion of the controls and the Z-prime measures assay quality by showing the separation between the distributions of the positive and negative controls (values between 0.5-1 are excellent, 0-0.5 acceptable and under 0 likely unacceptable for phenotypic screens). The signal-to-noise is the ratio between the positive and negative control values. It is important that there is a good window between the positive and negative values so that hits are robust.
Finally the workflow enables rapid visualization of the screening results. The quality control measures are shown in a bar chart and box plot, and the screening results are visualized in interactive scatter plots of the normalized cell viability and Z-score: specific points can be selected and then summarized in tabular form.
In summary, this workflow has three blocks: file-upload, data processing and visualization (Figure 1). Detailed descriptions of these steps are described below. And you can access the workflow and download it to try out yourself from the KNIME Hub.
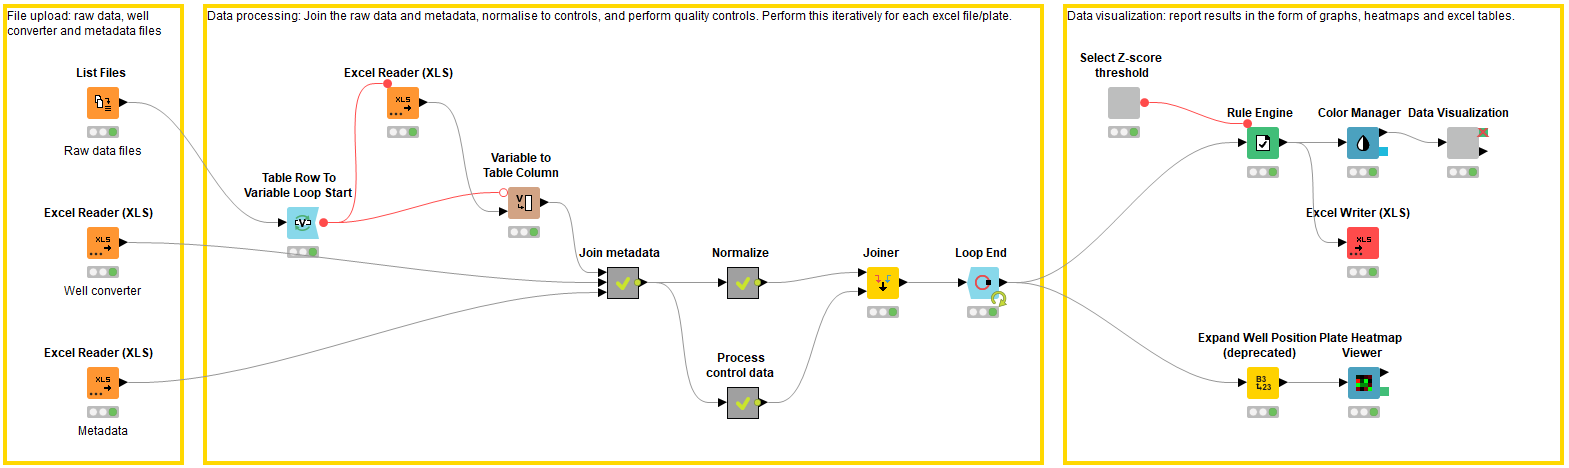
File upload: Accessing the raw experimental data and the metadata (block 1)
In the first block, the raw data and metadata files are accessed using the List Files and Excel Reader nodes. Each raw data excel file describes the raw data in each well of a 384 well plate (n.b. this workflow can be applied to any plate size, as long as it is defined in the metadata). In this case the raw data is generated from a plate-reader and describes a CellTiter-Glo® assay luminescence readout (Promega, G9681); the luminescence value is proportional to the number of viable cells in culture. The raw data values need to be joined to the metadata, which provides information on the location of the compounds i.e. the well of which plate they are located in. The metadata file contains columns describing the plate ID, well position, and compound ID, along with any additional relevant information. If the metadata describes the well position in a different format to the raw data files, e.g. A01 vs. A1 vs A – 01, the well converter file can be used to help join the metadata file to the raw data files.
Data processing: Joining the uploaded data, normalization and quality control calculations (block 2)
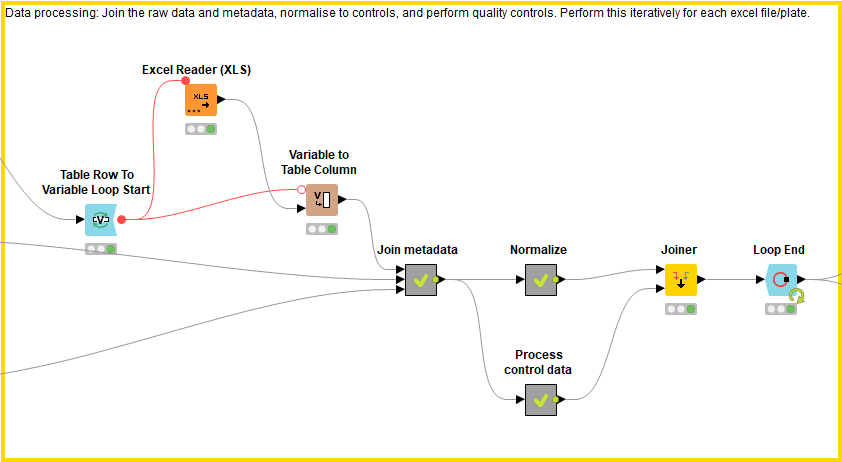
This block processes the data by joining the raw data files to the metadata file, normalizing the data, and calculating quality controls. These processes are applied to each raw data file individually and then concatenated using the Loop End node.
First the raw data files are joined to the metadata file. In order to know which plate the compound is found in, the excel file name, which describes the plate ID, is added as a column within the excel file (using Variable to Table Column, Regex Split, Column Rename). The raw data files (which now have a column describing the plate ID) are combined with the metadata using the well converter if necessary. Each plate is now described by an excel file displaying the raw data, well position, plate ID, and compound ID along with any additional relevant information.
Next, the data is normalized using the Normalize Plates (POC) node of the HCS-tools community nodes. Since every raw data file (describing an individual 384 well plate) is analysed iteratively due to the Loop nodes, each compound can be normalized to the positive controls within its plate: in doing so we take into account plate-to-plate variation. Following this, the mean value and standard deviation of the positive and negative controls are calculated respectively using the GroupBy node. These values are concatenated and added as columns in the results file. The Z-score is also calculated for each compound’s cell viability result using the Normalize Plates (Z-score) node.
In order to calculate quality controls for the screen, the positive and negative control values are taken for each plate. Their CV, Z-Prime and signal/background (S/B) values are then calculated using CV, Z-Primes (PC x NC) and the Math Formula nodes respectively.
The processed data (normalized values and quality control values) are then joined together with the raw data and metadata.
Data visualization: Interactive view of processed/normalized data vs. controls (block 3)
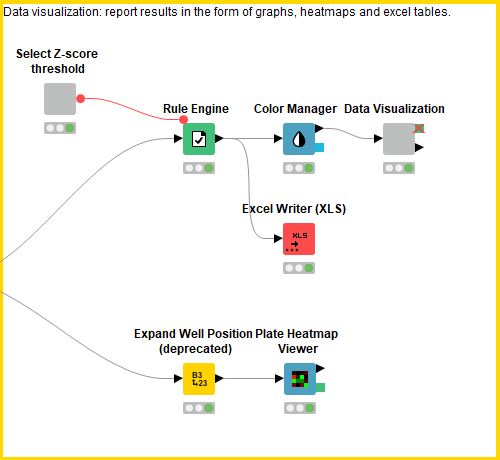
This block contains a series of configurable nodes to visualize quality control results as well as an interactive table linked to a scatter plot displaying the processed data.
First, the user can select the Z-score threshold that defines a hit compound by executing and opening the view of the “select Z-score threshold” component. Next, in order to build a descriptive scatter plot of the data, the Rule Engine node assigns group names to the positive controls, negative controls, hit compounds and non-hit compounds and the colour manager assigns particular colours to these groups for the scatter plots. Following this, the Component “Data Visualization” contains a Bar Chart, Box Plot, 2x Scatter Plot and Table View nodes. The Bar Chart and Box Plot describe the quality control values (CV values, Z-prime, S/B), and the Scatter Plots show the normalized cell viability data and the Z-score data. It is possible to interact with the scatter plots: one can select values in the scatter plots and this/these value(s) will be described in the table (Figure 4).
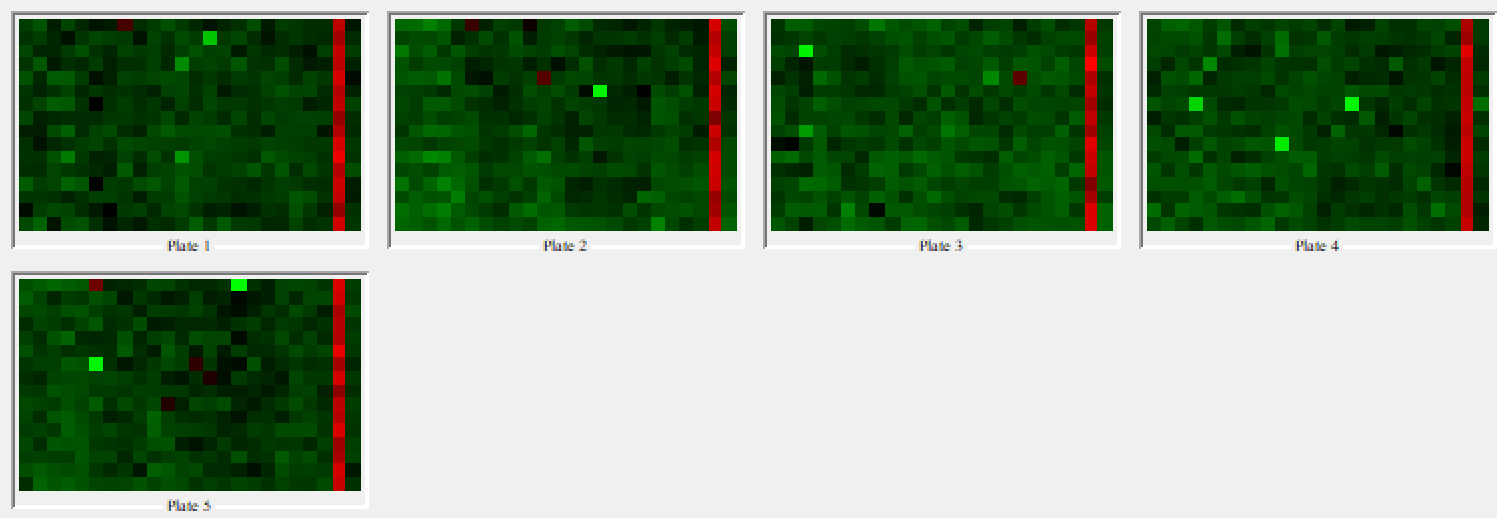
The Plate Heatmap Viewer node enables heatmaps to be displayed for all the 384 well plates (Figure 5). Heatmaps can be useful to assess the quality of the assay e.g. it is possible to assess the liquid handling performed in a screen as one can see patterns in cell seeding. In order for the Plate Heatmap Viewer to work, the Expand Well Position node must be applied. This takes a string column containing well positions e.g. C14 and appends two columns called “plateRow” and “plateColumn”.
Finally, the Excel Writer node converts the processed data into an Excel File.
Summary
This workflow is useful for anyone wanting to process and analyse large sets of raw data generated from HTS. Hit compounds can be identified using tunable criteria and visualized in an interactive scatter plot in which single points can be selected and read in tabular form. Moreover, quality control calculations such as the Z-Prime, signal/background (S/B) and CV are performed and visualized, depicting the overall robustness of the screen.
Note. The workflow that was described in this blog article is available for download from the KNIME Hub: HTS workflow
Authors

Catherine Hansel
Katie is conducting her PostDoc in Oscar Fernandez-Capetillo’s laboratory at the Karolinska Institutet/SciLifeLab. This lab focuses on high-throughput phenotypic screening. She is currently conducting a large screen for compounds that limit amyotrophic lateral sclerosis (ALS) associated poly(PR) dipeptide toxicity and has used this workflow to assess the group’s screening results

Schayan Yousefian graduated from the University of Heidelberg with a Master of Science in Molecular Biosciences. He is currently a Ph.D. candidate at the German Cancer Research Centre (DKFZ). In his Master thesis he investigated the role of intestinal stem cells in the gut-mediated immune response of Drosophila. His research interest centres around single-cell biology and the use of different sequencing techniques to study cell identity and cell type specific functions. Additionally, Schayan has experience in image-based analysis for high-throughput compound screenings and spatially resolved transcriptomics. Therefore, he has a keen interest in exploring computational methods for high-content data analysis.

Anna H. Klemm works as a BioImage Analyst within the BioImage Informatics Facility, SciLifeLab, Sweden. She did a PhD in cellular biophysics at the University of Erlangen-Nürnberg and after a Postdoc at the Max-Planck-Institute CBG, Dresden. Both during her PhD and the Postdoc she quantified biological processes by applying different microscopy techniques and image analysis. Before starting at SciLifelab she worked as a BioImage Analyst at the Biomedical Center, LMU Munich.
Picture of Anna Klemm: P. Waites, Uppsala University

Jordi Carreras-Puigvert is currently Assistant Professor at the Oscar Fernandez-Capetillo lab at the Karolinska Institutet/SciLifeLab. He has pioneered the use and implementation of high-throughput screens throughout his career, from exploring the DNA damage response in mouse Embryonic Stem cells, and c.elegans at Leiden University, and Leiden University Medical Centre, the Netherlands, to profiling the human NUDIX hydrolases at Karolinska Institutet, and now applying his knowledge to drug discovery against amyotrophic lateral sclerosis and cancer.
Coming Next …
If you enjoyed this, please share this generously and let us know your ideas for future blog posts.