In the context of machine learning models, interpretability means the ability to explain (to a human) what the model is actually doing. But ML models are hard to explain. That's why a bank wanting to compute credit scores for example, might still go for a simpler process that is explainable over an ML model that isn't. Even if the ML model is actually more accurate.
One way to increase our understanding of the model is to use feature importance. So after training a machine learning classifier, you might wonder:
-
Which features is my model using the most?
-
Which features are mostly useless to my model?
-
Which features are critical to making a prediction in most cases?
These questions can be easily answered if you’ve trained a simple model like a decision tree or a logistic regression. With these model types all you need to do is look at the simple structure representing the final model and extract overall feature contributions measuring how each input variable of the ML model has contributed to its output on average. However, with a more complex model, that has been trained using deep learning for example, it becomes quite hard to decipher the trained model algorithm.
Instead of spending time inspecting the inner-mechanics of your model, which are unique to the precise ML algorithm and library you applied, you could instead use model-agnostic techniques. The advantage here is that they always work no matter which model type you are trying to explain. Via those techniques an approximation of the overall feature contributions, which we call global feature importance, can be extracted in an array or list of values, but your work isn’t over! Often, you will have to explain them to non-ML-experts in your organization via data visualization.
Compute and Visualize Global Feature Importance
By combining eXplainable AI (XAI) methods and Guided Analytics techniques you can extract generic feature contributions from any black box classifier and visualize them in an intuitive way via interactive views.
Below we are going to see the view generated by the Global Feature Importance component we designed. The generated view displays overall behaviors of the model via two XAI techniques: global surrogate models and permutation feature importance.
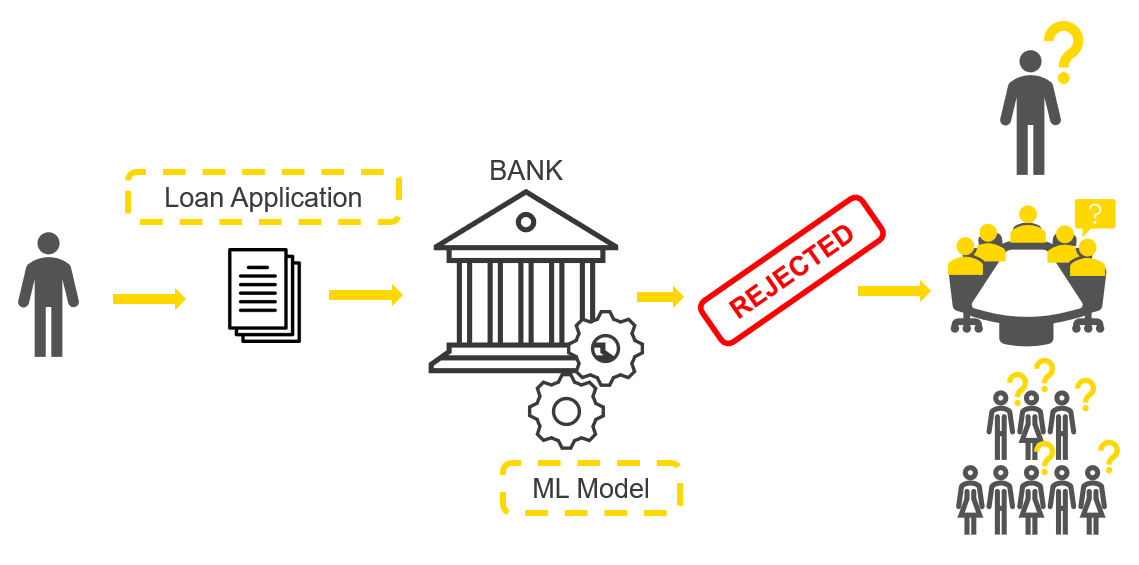
To showcase the global feature importance view we are going to use a credit scoring use case (Fig. 1) : A model is trained to either accept or reject loans based on data on the applicants. It is clear that how this model computes prediction has to be understood by the bank, given the impact it might have on people’s lives.

Note. The model in our example was never actually used in the real world and was trained on a Kaggle dataset only to showcase the XAI views. This use case is however interesting to different stakeholders: the loan applicant, the bank, and society in general given the ethical implications.
Let’s start now with explaining the global behavior of the credit scoring model and answer this question:
Which features are globally the most important for the model?
By “globally” we mean that on average across all predictions we want to find the most important features and also quantify and rank this importance. The methods adopted are Global Surrogate Models and Permutation Feature Importance.
Global Surrogate Model is an interpretable model trained on the same set of features to reproduce the original black box model predictions. The surrogate model, when its performance is high enough, should mimic the behavior of the original model, even reproducing the same mistakes. Given that the surrogate model was trained with an interpretable ML algorithm, we can explain the original black box model by extracting the feature importance from the surrogate model. We trained three global surrogate models: a generalized linear model (GLM), a random forest, and a decision tree. Then we extracted the feature importance from the surrogate models and visualized it, based on each unique ML algorithm.
Permutation Feature Importance measures the decrease in the model’s performance after each feature was randomly reshuffled, breaking the relationship to the target. This technique relies on the intuition that if you shuffle original data values with random ones only for a single feature the overall model performance does not change a lot.
Subsequently, this means that in the majority of cases, the model will ignore that feature when computing predictions.
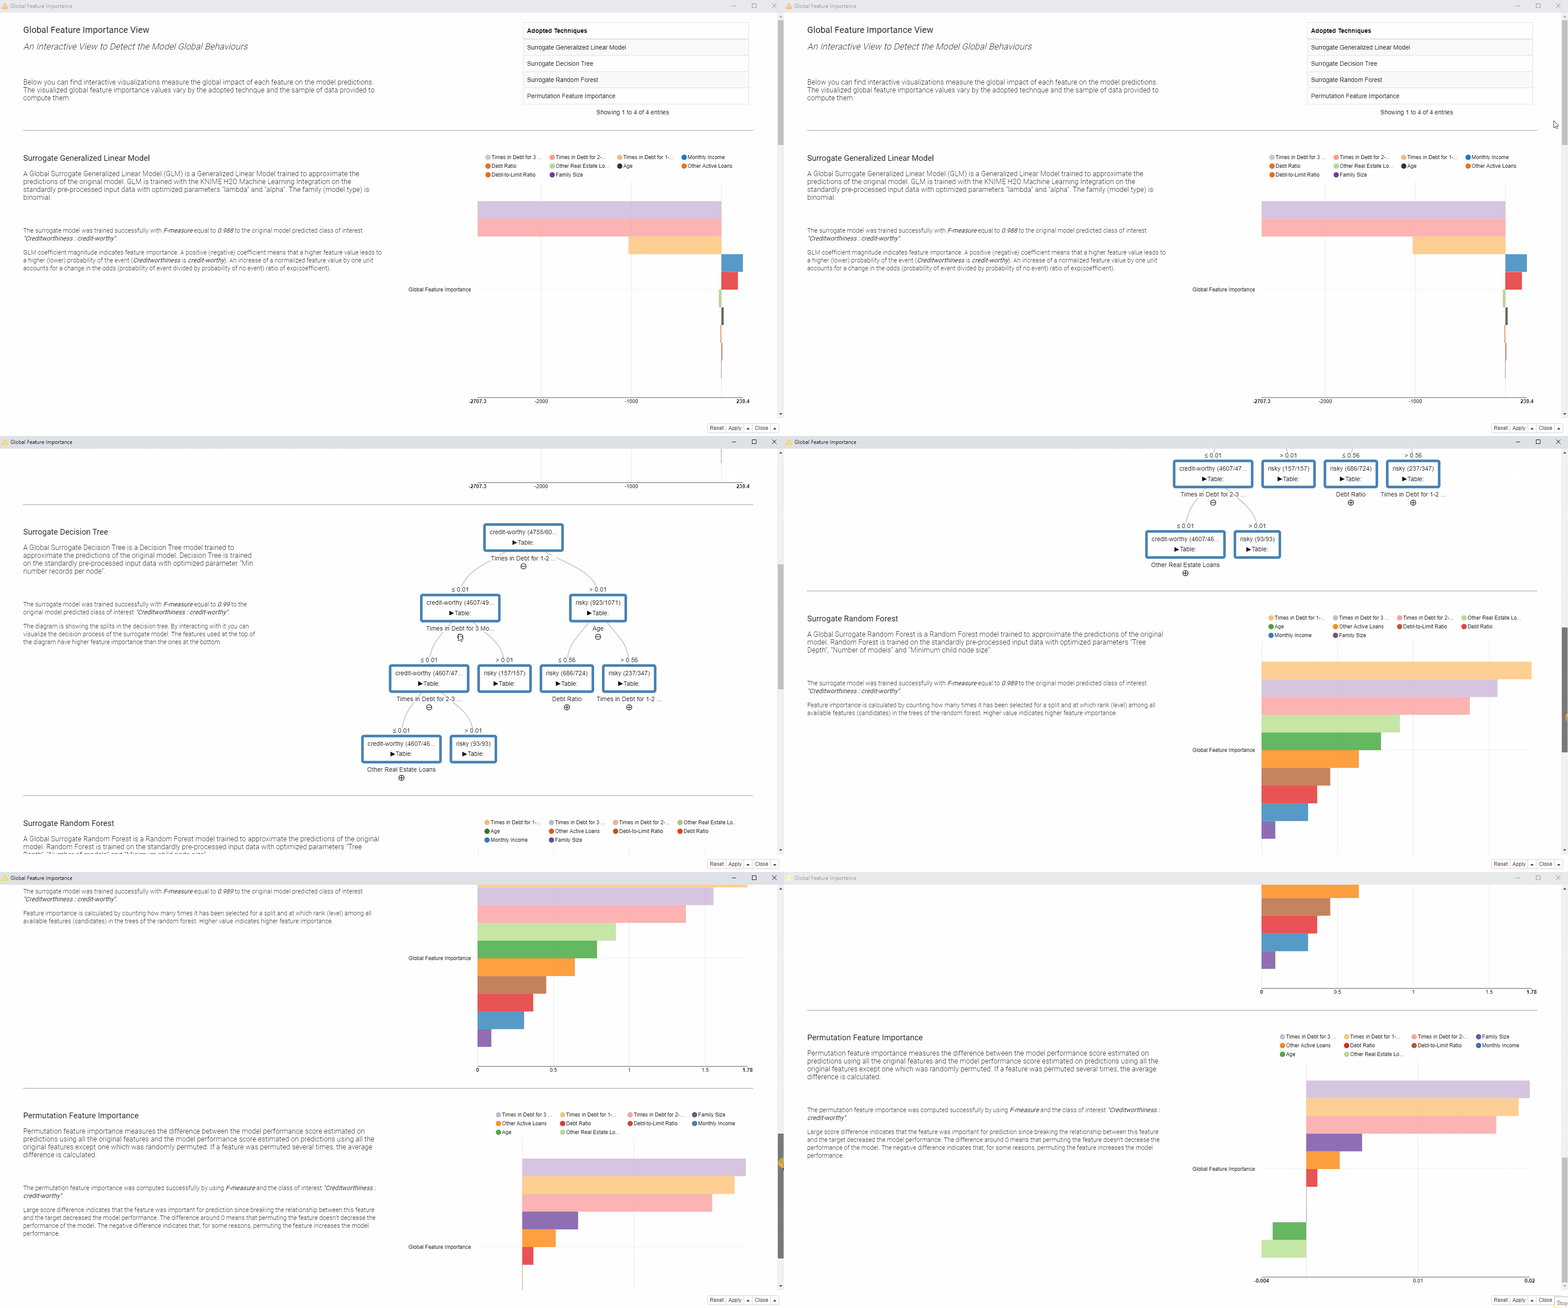
Let’s now look at the visualization the Global Feature Importance component produces (animation in fig. 2). It is designed to provide easily digestible information for non-ML-model experts. On the left, are brief descriptions of the adopted global feature importance techniques explaining how they were computed. On the right, the global feature importance is visualized in most cases as a horizontal bar chart, with each bin indicating the importance of the feature.
Tip: Download the Global Feature Importance component from the KNIME Hub
For the surrogate decision tree the interactive view visualizes the actual diagram of the tree, where the most important features are visualized close to the root of the tree.

So how does the visualization help us to answer our question: Which features are globally the most important for the model?
In this case, we can see that we have received quite consistent results. According to the four applied techniques, the most important features are: “Times in Debt for 1-2 Months”, “Times in Debt for 2-3 Months”, and “Times in Debt for 3 Months or More”. Therefore, one general explanation (and recommendation) from a bank could be - don’t get debts! Quite obvious of course.
The Visual Programming Workflow behind the Global Feature Importance View
The Global Feature Importance view we have shown was created in the free and open source KNIME Analytics Platform with a workflow (Fig. 3). No Javascript or Python was adopted. The interactive view and its backend are packaged as a reusable and reliable KNIME Component. You can find the Global Feature Importance component on KNIME Hub. The component was built within the Verified Component project and it is designed to work with any classifier trained on any dataset. This flexibility is given by the KNIME Integrated Deployment Extension, you can read the blog post Five Ways to Apply Integrated Deployment to know more.
Tip: Download the workflow Explaining Global Feature Importance of a Credit Scoring Model and the component: Global Feature Importance from the KNIME Hub.
You can also find more Verified Components on eXplainable AI in the Model Interpretability folder on KNIME Hub.

Add this Component to your Own Workflow
-
Connect the Workflow Object containing your trained model and any other data preparation steps
-
Connect a data partition, usually the test set, which offers a sample representative of the distribution.
Once executed the component outputs the global feature importance in table format. The component also generates the interactive view we previously showed. If you would like to add an enhancement to the component you can easily do so by editing the workflow inside.
Now Start Explaining Your Classifier Predictions!
In this blog post we illustrated the need for global feature importance using a credit scoring example, we showed an interactive view and explained the use case and finally we summarized how all of this is implemented via reusable KNIME workflows and components. Download the component from KNIME Hub and start explaining your classifier predictions!
----------
Explainable AI Resources At a Glance
Download the workflow and components from the KNIME Hub that are described in this article and try them out for yourself.
- How Banks Can Use Explainable AI (XAI) For More Transparent Credit Scorrng (overview article)
- Explaining the Credit Scoring Model with Model Interpretability Components (workflow)
- Global Feature Importance - Try the component and read the related blog article
- Local Explanation View - Try the component and read the related blog article
- XAI View - Try the component and read the related blog article
