This is part of a series of articles to show you solutions to common finance tasks related to financial planning, accounting, tax calculations, and auditing problems all implemented with the low-code KNIME Analytics Platform.
It’s 5 PM and your boss wants to know just how profitable the latest projects are for the business. Oh, and they need this information the next day by 8:30 AM, latest.
You know the drill and it’s messy. Preparing for this kind of project profitability evaluation means you have to gather all the relevant employee timesheet data, salary data, as well as information about the projects, their timelines, and the clients. All this data is stored in multiple Excel files. Bringing it all into one place is a time-consuming and tedious task.
In this article we want to outline a low-code data science solution that will enable you to access all the data you need and make the calculations quickly and accurately.
Watch the video to get a summary of the Timesheet Aggregation & Analysis solution and find a detailed write-up below.
Key takeaways of the KNIME solution
- Access data easily even if it’s scattered on different systems
- Automate for different data or time periods
- Visualize data plus option to automatically generate reports
The task: Evaluate project profitability with timesheet aggregation
Companies account for the time workers spend on tasks and projects in timesheets. This data can be used for all kinds of purposes such as invoicing, payroll processing, human resource management, and more. Here, we want to use it to check on the profitability of your company’s projects by comparing your project revenues with costs.
You’ll use your employee timesheet and salary data to calculate the labor costs for each project and compare these with the final project costs and the price you agreed on with the client.
The comparison helps you understand just how profitable the project is as well as reveal any discrepancies between the actual expenses and the budgeted price.
You now need to get this data from timesheet files, salary files, project-related files that indicate whether the project was for an in-house or external client, and client-related files which provide information on the client’s project budget.
Let’s see how this is done by the Timesheet Aggregation & Analysis workflow in KNIME.
The workflow: Access, calculate, and visualize project profitability

The KNIME workflow is set up to:
- Access the four different Excel files to collect the data
- Preprocess the data to be ready for calculations
- Calculate the actual prices and expenses for each project
- Calculate the total revenues and expenses related to all projects
- Calculate the profitability of each project
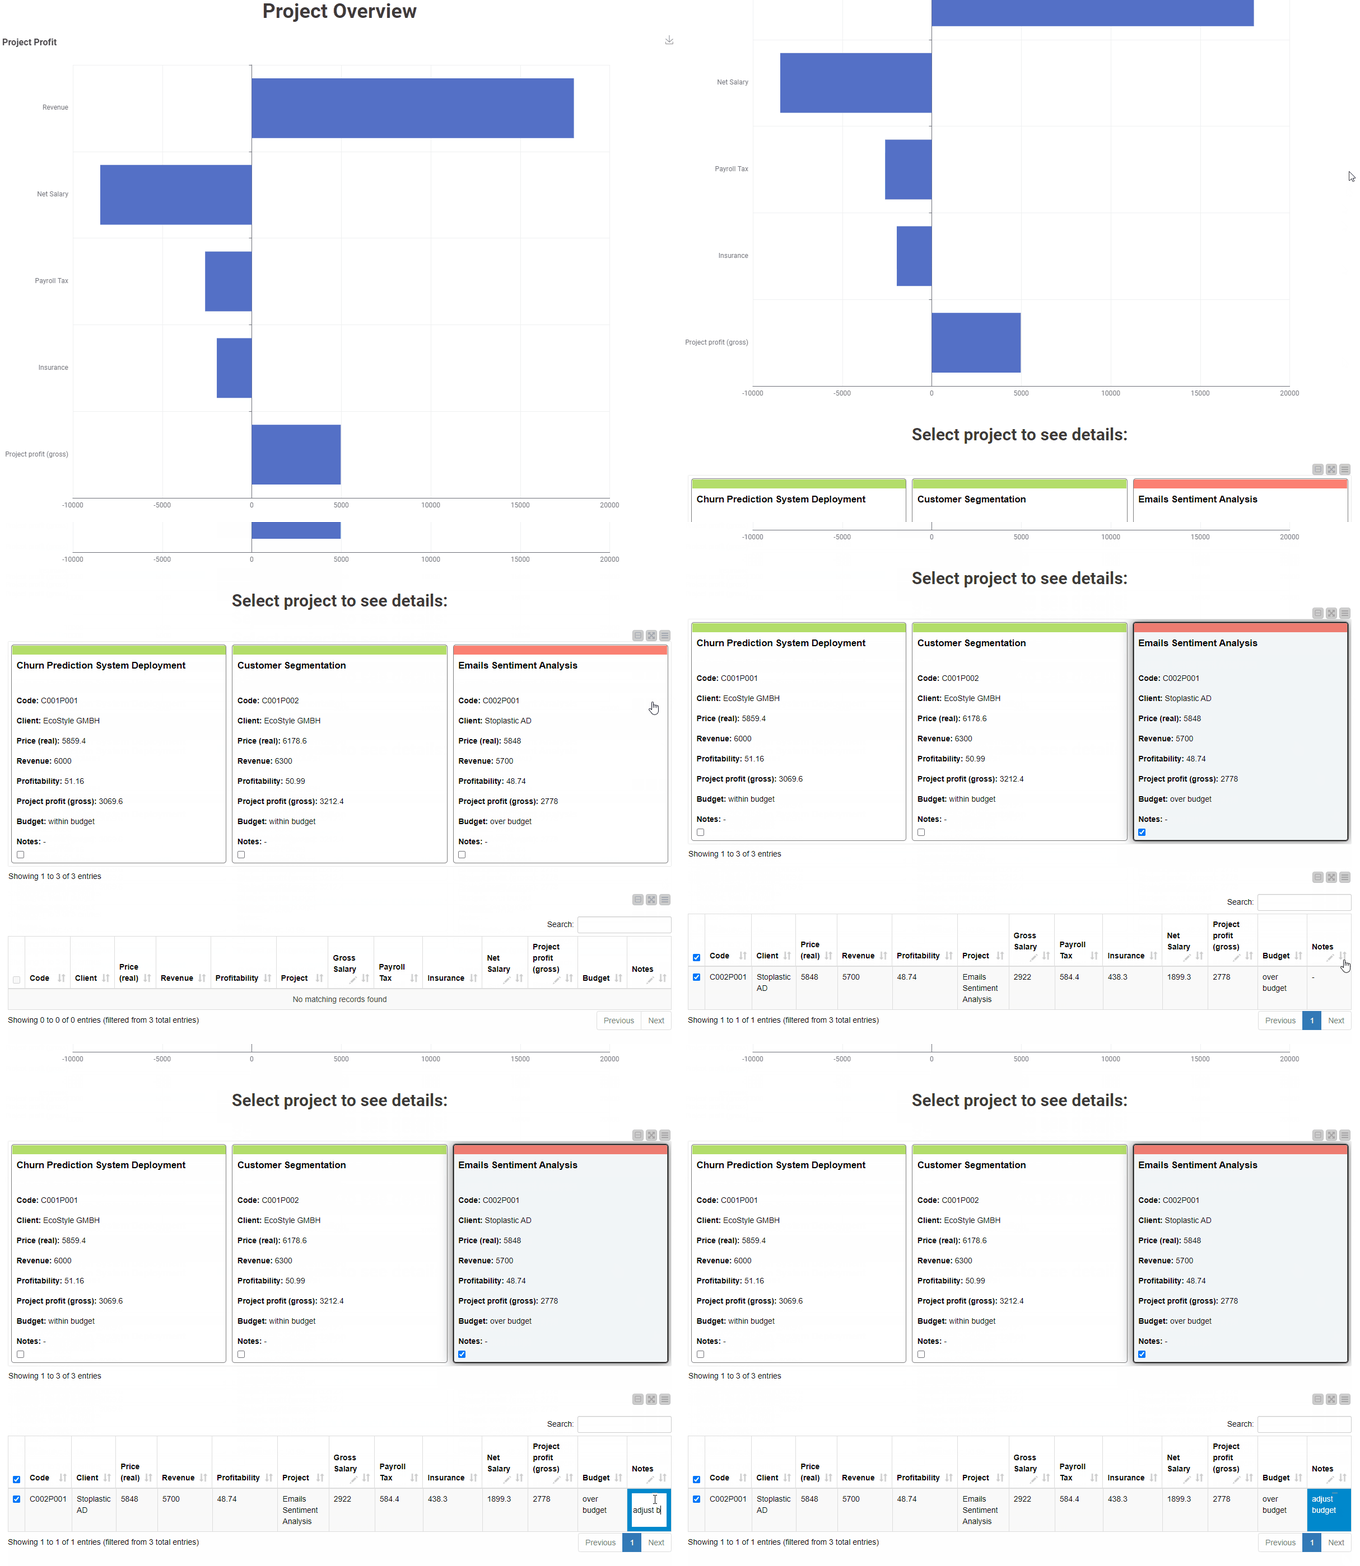
- Visualize the results in a Projects Overview dashboard
Let’s look at the calculation steps of this workflow in a bit more detail.
Calculate final project prices and the expenses for each project.
The final project price is calculated as the duration an employee worked on the project times the hourly rate charged to the client.
The total expenses consist of the salary costs which are calculated as the duration an employee worked on the project times the employee’s hourly salary rate.
Calculate total revenues and expenses from all projects
The workflow calculates the total profit from all projects by summing up the revenue and expenses of all projects.
Calculate each project’s profitability
Our solution now calculates each project’s profitability as the ratio of its profit to its revenue. It’s a performance indicator of the project that allows easy comparison.
Visualize project overview in dashboard
The workflow outputs all the calculations to a Project Overview dashboard, which you could send to your boss. You can now identify your well- and not-so-well performing projects. Based on this information your company can develop strategies to address potential discrepancies.

The Results: A re-usable timesheet aggregation solution to assess project profitability
The KNIME solution means you have the information your boss needs at your fingertips. Once set up, the KNIME workflow can be re-run at any time.
If you need to access additional files in different locations, KNIME offers many different connectors that you can add to your workflow and connect to the new source, for example, if your company has files in the cloud or in databases.
You can also add more functionality to the workflow to generate and distribute reports faster e.g. to automatically generate a PDF file of your dashboard, which you can send to your boss.
Why KNIME for Finance
KNIME Analytics Platform is an open-source free low code platform, offering a large variety of data operations. Thanks to its visual and intuitive user interface, implementing solutions does not require any programming expertise.
Download KNIME and explore more KNIME solutions for finance, accounting, and auditing. Use these example workflows as starting points for your own work or to get an idea about the capabilities KNIME provides for finance.
