
When research data cannot be found, when access, interoperability, and reuse are impaired, the impact can be significant, hampering data-driven innovation and knowledge discovery, jeopardizing the success of collaborations, and binding budget and resources in areas not contributing to the competitive edge. The FAIR guiding principles, which were published in 2016, aim at facilitating maximum data reuse and are now gaining more and more attention in academic research as well as in industry, with many gatekeepers such as funding organizations and publishers now enforcing their implementation.
In this article, we show how KNIME Analytics Platform can contribute to creating FAIR data sets, from reading various data formats, to restructuring data, and extending the metadata to meet the FAIR metadata standards with controlled vocabulary and user-defined information.
What are FAIR data?
Maybe you have already stumbled across the term FAIR data in various contexts? The concept of FAIR has been around since 2016 and has gained substantial traction not only in the academic research environment (especially in health and biomedical research), but also in industry.
FAIR is an acronym and stands for Findable, Accessible, Interoperable, and Reusable. Behind those four words is a set of principles that focuses on ensuring that research data and objects are available and reusable and thereby will be actually reused. Some estimates say that up to 80% of results from publicly funded research is never used again, e.g. included in a meta or re-analysis. Considering the technical possibilities we have these days to deal with data, this is a massive waste of resources. The reason for impaired reuse lies often in insufficient documentation of data and metadata, or formats that are not machine friendly. Leaving these resources untouched negatively impacts collaborative research activities, costs, and resources. Hence, ensuring that data is reusable also ensures the value of these resources is maximized as much as possible.
The ultimate aim of following FAIR principles is that machines as well as humans can find, access, interoperate, and reuse each other’s data stemming from research or other objects. That extra bit of value lies for sure in their emphasis on machine-actionability, which has been lacking in previous initiatives, for example like open source. Gatekeepers like publishers or funding organizations have picked up the FAIR principles to various extents and mandate their application.
Find out more about the FAIR principles and data management and read the original publication by Wilkinson et al. here. The FAIR Principles website provides further information.
The FAIR Principles website provides further information.
How you can use KNIME to help make your data FAIR
This is the more interesting issue here. Well-structured, machine-readable, and documented data are not only important for people working with big data or databases: This also applies to people that maybe don’t feel addressed in the first place because they only handle a manageable amount of data. These are often present in unstructured Excel spreadsheets, maybe with some manual analysis right next to the ‘raw’ data. KNIME Analytics Platform is a great tool for re-structuring these kinds of data and bringing them into a machine-friendly, interoperable form. KNIME Analytics Platform can read numerous different file formats, extract data, and transform them. It can concatenate tables or combine/join them on user-defined criteria, and all of that without - or only a minimal need for - coding. It can be used to extend the metadata with controlled vocabulary and even automatically write the output to respective repositories.
The workflow, FAIR data with KNIME, presented here represents a use case from academic research, more precisely from toxicological testing. It uses data derived from a cell-based in vitro assay conducted on 96-well plates, in which the effects of substances on the cells are evaluated using automated microscopy and image analysis. This workflow is in principle applicable to any assay that is conducted with a fixed plate layout.
Concatenating the input data
To avoid confusion, we want to quickly specify the terms data and metadata for the ones who are not familiar with them: Data refers to a piece of information, e.g. numbers from measurements or quantification, images or observations. Metadata refers to data describing the data. Metadata specifies the relevant information about the data which helps in identifying the nature and feature of the data.
The data that have been used in this example are data from the image-based NeuriTox assay (also called UKN4), which assesses neurite outgrowth of human dopaminergic neuronal cells in response to substance treatment. In this assay, a proof of concept substance library assembled by the U.S. National Toxicology Program (NTP) was screened, and the library comprised 80 (potentially) neurotoxic substances. If you are interested in the outcome, the results were published in 2018 in this paper. All the data files used here have been kindly provided by the Leist Lab at the University of Konstanz, Germany.
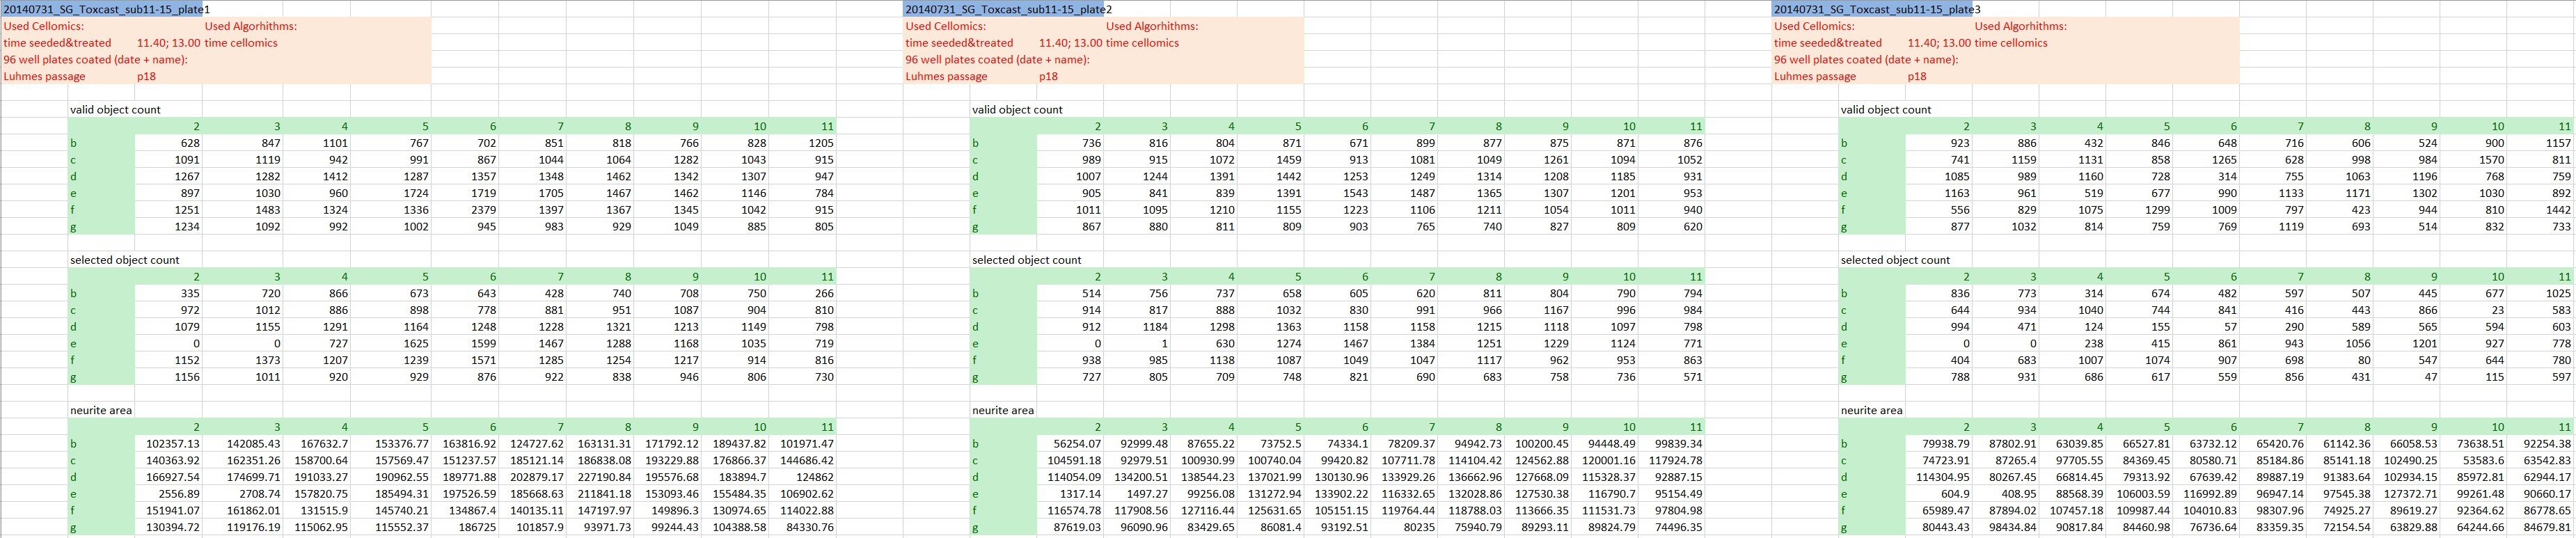
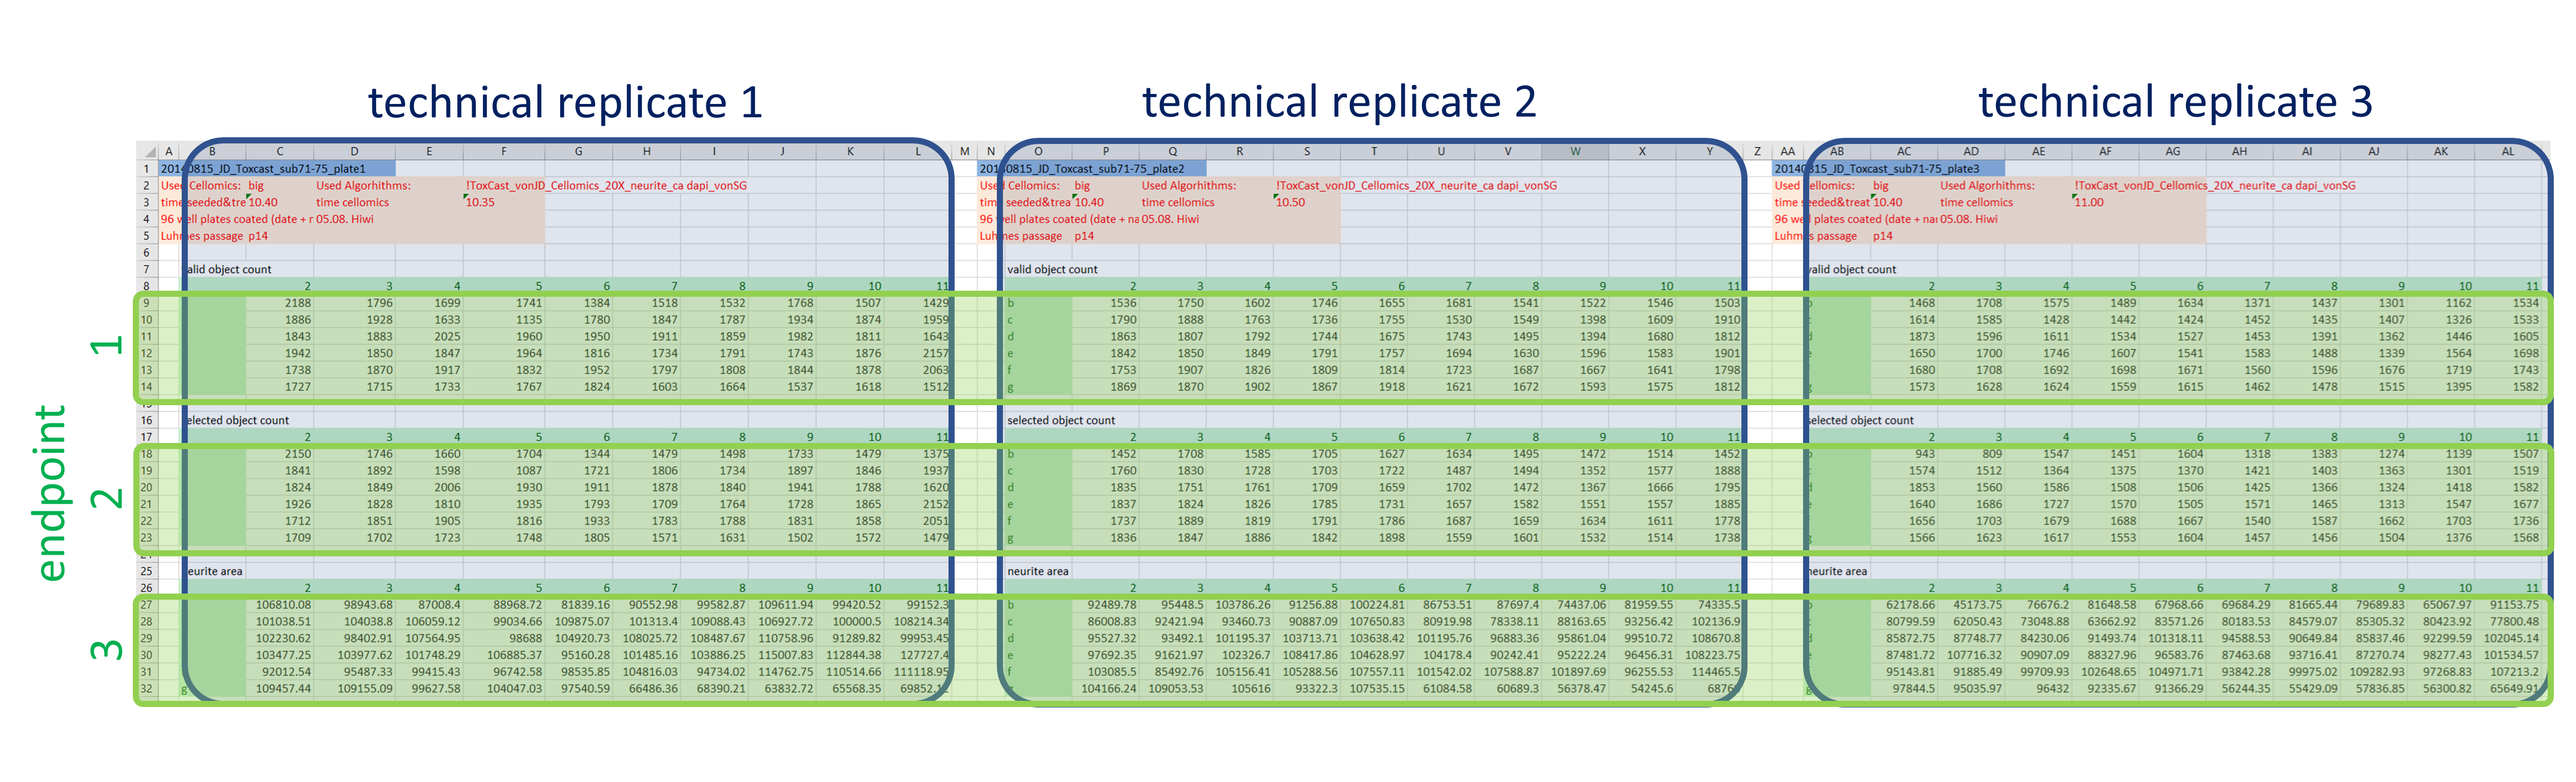
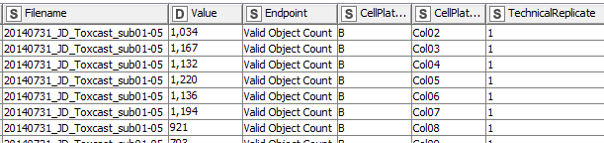
The actual raw data are images and won’t be shared here, but we’re going to keep it as raw as possible. At this stage that’s the numeric outcome of automatic image analysis, which has been stored in 48 individual Excel files of a defined format (see Fig. 1). The technical replicates are represented by the three blocks of columns, while the three different endpoints are in row-wise blocks (and to answer the attentive reader’s question: Yes, the technical replicates are on separate plates. Yes, that’s unusual, but it has been really thoroughly tested and validated and it does not affect the variability of the outcome).
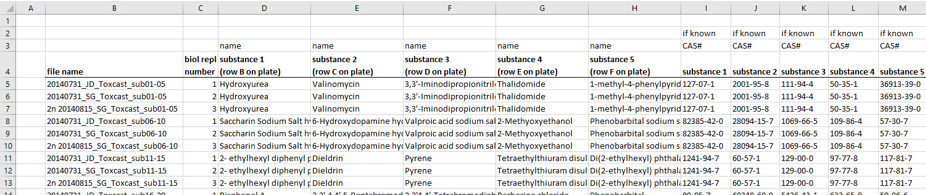
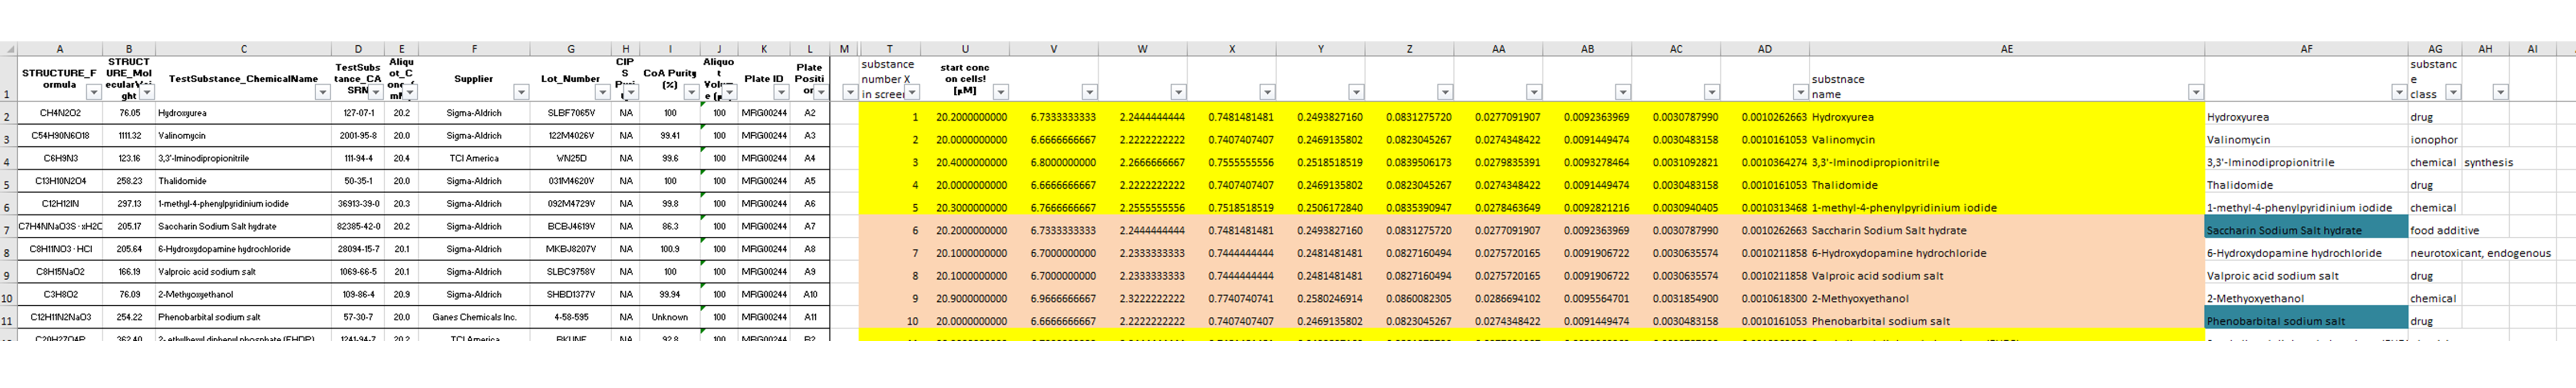
The information about the compounds and their tested concentrations have been stored in two separate Excel files. One provided information about which Excel file contained the raw data of which compound (Fig. 2), and a second Excel file included the compound concentrations, plus some more general information about the compounds, such as the chemical formula, the molecular weight, the CAS No., the supplier, etc.
A)
B)
Step 1: Re-structuring data to make them machine-friendly
In a first step, the data are extracted and re-arranged in a way that each row represents one data point, and technical replicates of the same data point (i.e. compound effect at a defined concentration) are not located in separate columns anymore. Having data from three plates in an actual plate-like layout next to each other in the same Excel file might be convenient for humans, but machines have a hard time parsing that structure. Using a loop, this is done for all 48 data files and the resulting data table is extended with each iteration. In the end all values (representing number of (viable) cells and neurite area) are now listed underneath each other in one column, while the endpoint they represent is indicated in another column , as well as the position on the cell plate and the technical replicate they originate from (Fig. 3). This might not be that neat for humans anymore, but enables machines to easily parse the data and deal with it.
Step 2: Adding the compound information
In a second step, the information about the tested compounds is added to the previously generated data table. Before, that information was stored in two separate Excel Tables. The data are re-arranged in a way that both compounds and CAS numbers are merged upon the file names of the original Excel input sheets. Information like supplier, structural formula, etc. are extracted and appended to the data table.
Step 3: Enriching the data with chemical identifiers and controlled vocabulary
To improve interoperability and simplify data re-use in other contexts, the information about the chemicals has been extended by SMILES, InChIs and InChI keys. Originally the chemicals were provided only with CAS numbers as identifiers, but these are not very applicable for many purposes. We used REST API to retrieve the SMILES of the substances from an NIH resource. These were then also converted to InChI and InChI keys using the RDKit KNIME Integration community nodes. This facilitates further use in a cheminformatic context, e.g. substructure search, etc.
Information about the biological target of a substance or its use is always nice to have. Therefore, we extend the metadata with information from the chEMBL and chEBI database using REST API. Knowing about the roles, effects and molecule type, for example, is not only useful for human researchers; having the identifiers and defined vocabulary of widely-used databases and ontologies in this field enhances interoperability and complies with the FAIR principles. Furthermore we extracted metadata about the request such as database and API version, release and query date.
Step 4: Adding user-defined metadata
There are no intrinsic metadata to the quantified values available, but we want to add some user-defined metadata that will help others to understand the data table and give more information about each column and the data therein. To do so, we use the interactive Table Editor node which allows manual entries to an existing table. We added for example information about what the control samples actually are, units or links to the DB-ALM assay protocol and the ATCC cell line registry (DB-ALM is the EURL ECVAM Database on Alternative Methods to Animal Experimentation, ATCC is the American Type Culture Collection).
Step 5: Writing the data and exporting the workflow summary
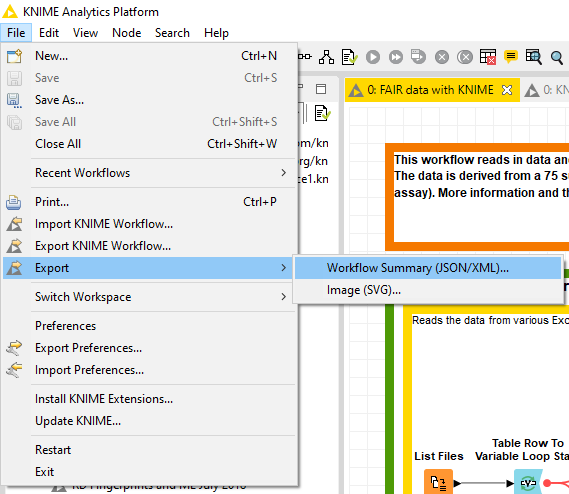
In the last step the data table and the metadata created in step 4 are exported as CSV files. We are using flow variables to ensure that the data table and the user-defined metadata share parts of the file name. This way the two files can be nicely matched. To ensure maximal transparency, we will also export the workflow summary of this workflow used to create the data table and metadata. This summary can be obtained either by ‘File > Export > Workflow Summary (JSON/XML)…’ menu in the KNIME Analytics Platform, or through a KNIME Server's REST API (Fig. 4). It can be either a JSON or XML file, and if you want to extract the most relevant information from that file, this component will help you.
Read more about the workflow summary feature in KNIME in the blog article, Compliance and Explainability with Metadata Mapping, by Phil Winters.
It should be pointed out that by no means the use of KNIME alone makes data FAIR, and there are for sure aspects of the FAIR principles that KNIME is not suitable for (mostly concerning findability and accessibility), e.g. creating persistent, unique Identifiers (PID). The DOI (digital object identifier) is probably the most widely known and used persistent identifier, but these can only be assigned by DOI registration agencies (KNIME is not one of these). However, KNIME can be used to introduce identifiers of individual data points within the data set.
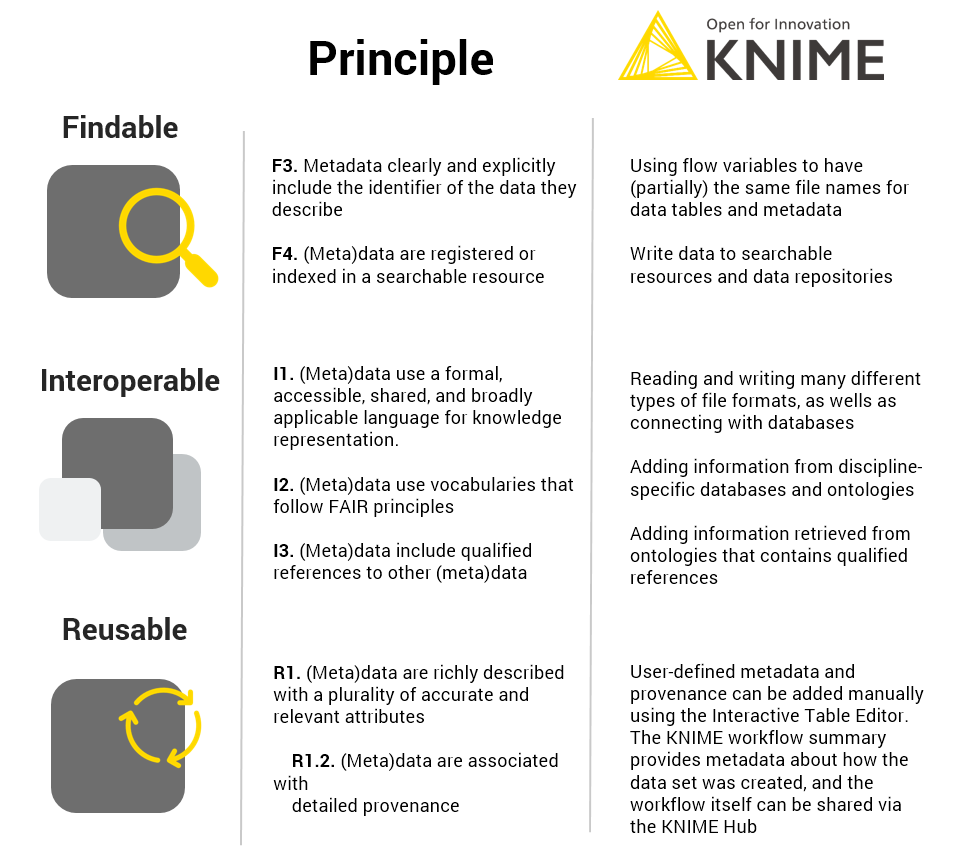
KNIME can contribute to interoperability and reusability, as we have shown in this blog post (Fig. 5).
- It can read, write and integrate numerous different file formats (serving principle I1), be used to extend the metadata with a controlled vocabulary (in this case GET requests to chEMBL and chEBI, serving principle I2)
- Give qualified references (in this case extending the metadata with roles of the substances as defined in the chEBI ontology, principle I3)
- It can add plenty of user-defined metadata e.g. the ID of the DB-ALM assay protocol, DOI to linked publications, the ATCC cell line registry or the contact details using the interactive Table Editor serves principle R1, and specifically R1.2.
- The workflow summary provides information about how the data table was created, therefore also serving principle R1.
Any workflow itself will be assigned a unique short link when it’s uploaded on the KNIME Hub, providing something identifier-like (we are well aware this is not a full-grown PID). Although the principle of accessibility is mostly covered by the data repositories, we want to mention that data can be shared within a workflow. As KNIME Analytics Platform is an open access data tool, this provides partners not only with the data, but also with the process with which it was created.
Summary of how KNIME contributed to FAIR data management
We have created a KNIME workflow that combines the data from 48 individual data Excel files into one large data table. While the Excel sheets were convenient for humans, they were not very machine-friendly. The data about the tested chemicals that were previously provided in two separate files are now integrated into the large data table. The chemical identifiers were extended by SMILES, InChI and InChI keys using the RDKit KNIME community nodes and REST API to enhance interoperability. The metadata was extended by domain-specific, controlled vocabulary using REST API and programmatic access to the chEMBL and chEBI databases. To comply with FAIRness, details about the used databases and ontologies are extracted as well. There is no ‘intrinsic’ metadata available e.g. for the image analysis, but we added plenty of ‘user-defined’ metadata. The data is now ready to be uploaded to a (project-specific) data repository, meeting the funding requirements of the project. Depending on the repository the (meta)data should be deposited at, KNIME also facilitates automatic upload using a PUT request. Project partners or researchers working on follow-ups can now access a well-structured data table that enables them to recapitulate the published results and integrate it with newly generated data or data from chEMBL for example.
KNIME itself contributes to FAIR data management by providing extensive metadata about workflows (exportable workflow summaries), as well with the KNIME hub where workflows can be made publicly and persistently available by and for any user, ensuring transparency and reproducibility.
In case you are dealing with laboratory data such as microplate or imaging data, next week’s blog post about retrieving raw data directly from laboratory devices and automatically analyzing it with KNIME Analytics Platform might be interesting for you as well. Go and check out the new SiLA2 integration in the Life Sciences space on the KNIME Hub.
References
- Delp J, Gutbier S, Klima S, et al. A high-throughput approach to identify specific neurotoxicants/ developmental toxicants in human neuronal cell function assays [published correction appears in ALTEX. 2019;36(3):505]. ALTEX. 2018;35(2):235-253. doi:10.14573/altex.1712182
- Krug AK, Balmer NV, Matt F, Schönenberger F, Merhof D, Leist M. Evaluation of a human neurite growth assay as specific screen for developmental neurotoxicants. Arch Toxicol. 2013;87(12):2215-2231. doi:10.1007/s00204-013-1072-y
- Wilkinson MD, Dumontier M, Aalbersberg IJ, et al. The FAIR Guiding Principles for scientific data management and stewardship [published correction appears in Sci Data. 2019 Mar 19;6(1):6]. Sci Data. 2016;3:160018. Published 2016 Mar 15. doi:10.1038/sdata.2016.18