
There are many declinations of data science projects: with or without labeled data; stopping at data wrangling or involving machine learning algorithms; predicting classes or predicting numbers; with unevenly distributed classes, with binary classes, or even with no examples at all of one of the classes; with structured data and with unstructured data; using past samples or just remaining in the present; with requirements for real-time or close to real-time execution or with acceptably slower performances; showing the results in shiny reports or hiding the nitty gritty behind a neutral IT architecture; and with large budgets or no budget at all.
Is the CRISP-DM Cycle Enough?
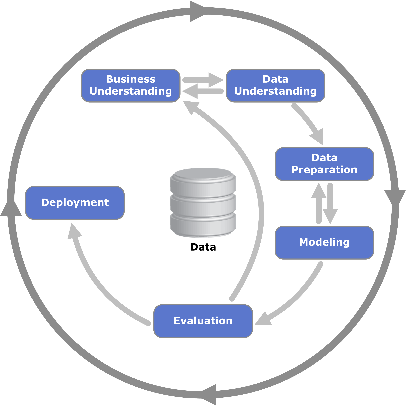
While the general development of a data science project is relatively standard, following for example the CRISP-DM cycle, each project often needs some special customization — that special ingredient to adapt to the particular data, goals, constraints, domain knowledge, or even budget of the project.
The CRISP-DM cycle recommends the following phases for any data science project: data and business understanding, data preparation, model training, model optimization, model evaluation, and finally model deployment. More details on their practical implementation are available in the post “Analytics and Beyond!”
These guidelines, as provided via the CRISP-DM cycle, are quite useful for a standard project; that is, a project with sufficient training data, equally distributed classes, no special requirements for speed or final visualization, and so on. The guidelines do not provide any details to address the specifics of data, project features, and end-user requests.
Customizing the CRISP-DM Cycle to Fit Your Project
Even if the process is clear in our mind, choosing among the many machine learning algorithms and deployment options can prove arduous without an appropriate orientation map. We would like to sketch such a map to help understand in which direction to move given the characteristics of the data science project at hand.
We structured our orientation journey with a series of questions of increased complexity. We start by addressing the basic doubts about the type of project, and we move to execution and deployment options for the productive implementation of the project.
Do I Need a Machine Learning Model?
In the naming confusion of the discipline in which we happen to work, we often put data science, data mining, artificial intelligence, business intelligence, and probably some other permutation of “data,” “science,” and “intelligence” in the same bucket. I am not completely clear on the nuances and coverage of each one of those names.
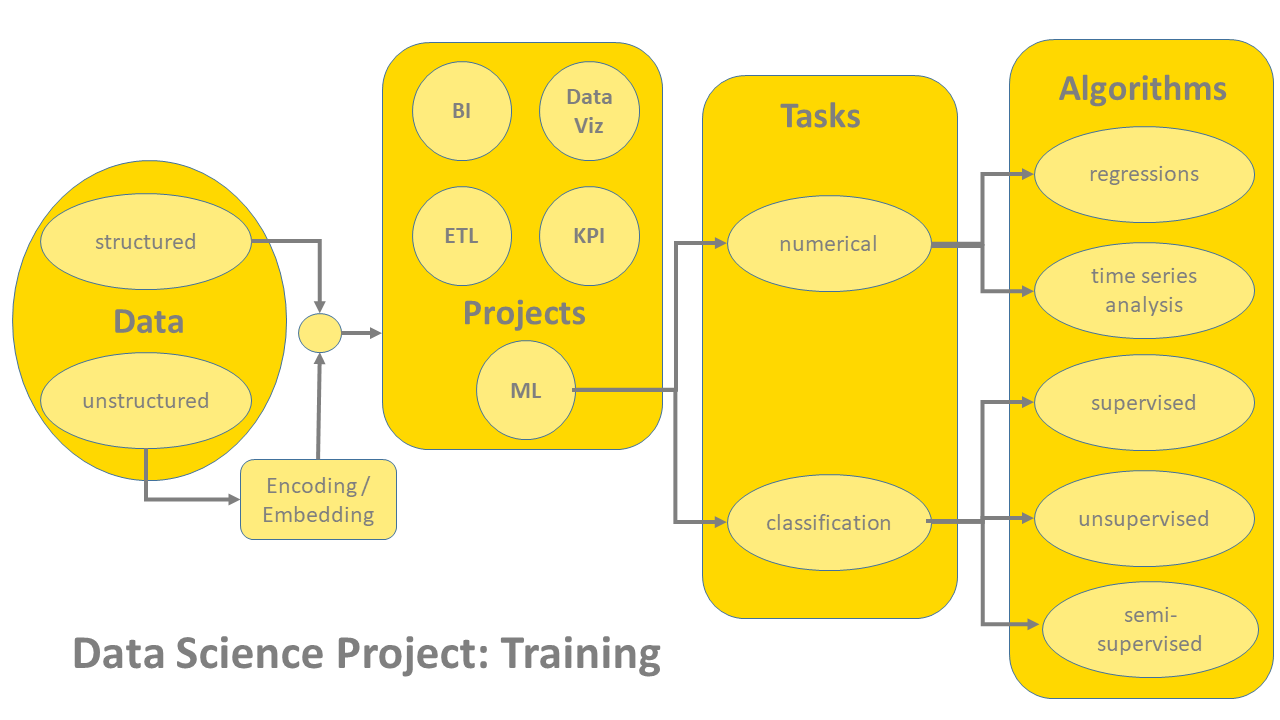
However, I do know that not all data related projects require a predictive model. Often, data blending, cleaning and transformation; calculation of KPIs; or organization of success metrics in dashboards or BI reports is all the project requires. In this case, pure data transformations and mathematical operations are sufficient, and machine learning models should not be used.
Classification or Number Prediction?

The second question refers to the nature of the variable to predict. Do we want to predict a class or a number? For example, do we want to predict the next product (class) the customer will buy or the hair color (class) trending next year? Or do we want to predict the price (number) of a washing machine in the next two weeks or the kwH (number) that will be consumed by the city of London tonight?
Notice that sometimes numerical prediction problems can be reduced to a classification task. For example, if I want to predict the rise or decrease of the washing machine price (and not the actual price in number of dollars), I can define three classes (“price raise,” “price same,” “price decrease”), and therefore, this becomes a classification problem.
The most common and easiest classification problem includes a binary class system: “true” or “false,” “disease” or “health,” “below” or “above” some value, and so on.
Once we have decided if we are dealing with a classification or a numerical prediction problem, we can choose from two different pools of machine learning algorithms. After training, classification algorithms output a set of nominal values (string), while numerical algorithms output numbers (integer or double).
Are Numerical Predictions the Same as Time Series Analysis?
Algorithms for numerical predictions do not necessarily implement a time series analysis. As the name states, time series analysis requires one additional constraint: time. Predicting numbers in random order, like in a linear regression, just associates a numerical output to a vector of input features. On the other hand, algorithms for time series prediction accept input vectors arranged in a specific time order.
Even though often the same numerical prediction techniques are also used in time series analysis, dedicated algorithms have been designed to take into account the time order of the input data during training. In the case of a project on time series, remember that the data partitioning into training and test set cannot be random, but it has to comply with the notion of past and future.
Supervised vs. Unsupervised Training Algorithms
Now, let’s get into the specifics of the data set. For classification problems, many Machine Learning algorithms require a labeled data set; that is, a data set where example vectors are provided and each example has been labeled with the right class. Such algorithms are called “supervised” and use this training set of labeled examples to define internal rules to output the right class when a specific input vector is presented.
However, often a labeled data set is a luxury. Unless labels are somehow automatically available, the labeling process is often expensive in time and money. If no labeled data set is available, we can resolve to clustering procedures, where patterns are grouped together on the basis of distances and rules.
If we still cling to a labeled data set, active learning procedures can be used. In this case, we start from a however-labeled data set. In the next few iterations, data subsets of critical points are manually labeled and their class automatically extended to neighboring points in an “unsupervised” manner.
Unevenly Distributed, Infrequent and Rare Classes
Supervised classification algorithms work best when the training data set sufficiently covers all different types and subtypes of the various classes. In a perfect project, the data are evenly distributed across all classes.
Sometimes, however, data are far from being evenly distributed. In this case, each class needs a sufficient number of representative data examples to appear in the final predictions. When classes are unevenly distributed, we might want the model output to reflect the original a priori class probability. In order to force the model to learn the various a priori probabilities, we can partition the original data set, applying stratified sampling to the class column. Stratified sampling generates a training set with the same class distribution as the original data set.
Sometimes one class is much more infrequent than the other classes in the data set. In this case, the unbalanced class distribution might bias the model and shadow the infrequent class. Here, we need to force-feed the model during training with an artificially more frequent class. This is obtained either by down-sampling the most frequent class (if the number of examples for the less frequent class are sufficient) or by oversampling (bootstrapping) the least frequent class.
There are extreme cases where one class is completely missing from the original data set. This is the case, for example, with anomaly detection in IoT. This scenario requires a slight change in perspective. In this case, a machine learning model is trained only on the data of the available class, a distance is calculated between predicted and real values, and a possible anomaly is deducted from the distance value.
In some cases, a class might be rare but full of consequences, like a loss of money in an investment or death in a medical procedure. Then, we should force the model to decide in favor of this class only if absolutely sure. This is usually obtained by applying a weight or changing the threshold value during model deployment.
Structured Data vs. Unstructured Data
Traditionally, the analysis of data refers to numerical values or nominal values. Referencing the world of databases, we refer to such data architectures as structured. In the last few years, however, there has been an injection of less traditional data in the field of data analytics. Texts, network graphs, tweets, reviews, etc., have become part of our databases and data lakes.
Special types of data need special types of processing. Text and network graphs, for example, need a special set of tools for parsing, cleaning, vectorization and, of course, visualization.
Shiny Reports, REST, and Plain Background Execution

Once the model has been trained, tested and accepted, it moves into deployment. The deployment workflow applies the model to new real-life data and produces the corresponding predictions. Predictions are then returned back to the end user.
In some projects, the deployment workflow is required to provide a nice interactive graphic dashboard for result presentation. The execution of the deployment workflow can be scheduled in order to regularly produce the designed dashboard.
Sometimes, however, results just need to be passed to the next application(s) within a network of web services. Here the deployment workflow needs to be deployed as a REST service itself.
In some cases, the output results are simply saved in a file (or a database), and no other visualization or REST interface is needed.
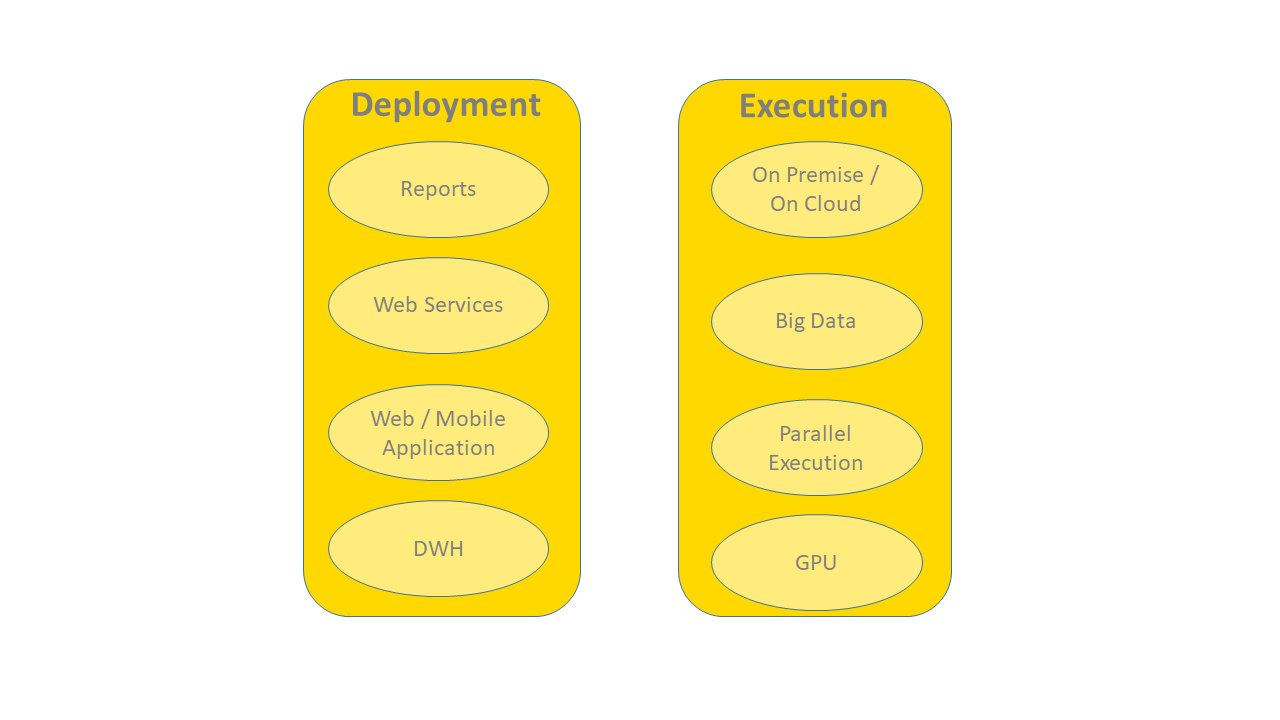
Execution Options: Big Data, Real Time, Streaming
Now the final questions. Do we need a big data platform? Do we need streaming? Do we need real-time execution?
Let’s start with the real-time execution. What we think of as real time is sometimes merely human-perceived real time. Just to make things clear, waiting a few seconds is perfectly acceptable to humans, but it is not necessarily real time.
Execution performance, of course, depends on the platform. However, not all projects require high-performance execution. Before starting a large investment on a distributed platform, think of what the execution requirements are. If the end user can wait a few seconds, then classic execution on a fast machine is acceptable.
If the amount of data is considerable and the waiting time becomes longer, parallelization of the execution might become necessary.
Streaming might also be a specific requirement for your project, even though most of the time refreshing the data read from file is enough to keep the result up to date.
As first published in Dataversity.
Author’s Note:

E-book – “Practicing Data Science. A Collection of Case Studies”
We have collected a series of use cases and the experience that came with their implementations in an e-book, “Practicing Data Science. A Collection of Case Studies.” This book is organized by application fields. It starts with the oldest data science area (the analysis of CRM data) then moves to recommendation engines for retail stores. Next, it covers projects in the financial industry, on social media, and time series analysis in IoT and then closes with a few cybersecurity projects.
All examples reported in the e-book refer to a workflow (or two) living on the KNIME EXAMPLES server, which are dutifully reported at the beginning of each section.
We hope this collection of data science experiences will help grow the practical data science skills in the next generation of data scientists. Interested readers can purchase the book here: https://www.knime.com/knimepress/practicing-data-science