The second season of Just KNIME It!, our series of weekly challenges on data analytics and data science, ended on October 24. We are thrilled to announce the newest generation of enthusiastic users who solved all of this season’s challenges—or, as we like to call them, KNIME KNinjas.
Before we jump into the announcement, you may be wondering what Just KNIME It! is, and why becoming a KNIME KNinja is worth celebrating.
We started Just KNIME It! in 2022 to help KNIME users improve their data science and analytics knowledge and hone their workflow building skills. In our first season, we issued a total of 40 challenges: one per week, levels easy to hard, and touching on a variety of topics. We noticed that they were well-received by our community, with tens of users solving the challenges. We kept a leaderboard, and by the end of that season we had our first generation of top KNinjas: four users who solved all challenges with creativity and efficiency, and whose solutions had teaching value to others. You can read more about these incredible champions here.
This year, we came back for a second Just KNIME It! season. We covered more data science and analytics topics than last year (for example, large language models (LLMs) and sentiment analysis), but shortened the series to 30 challenges based on user feedback. We followed the same structure of our first season: each week we published a new problem (levels easy to hard), and gave a week for our community to solve it before publishing our own solution. Solutions were uploaded onto the public KNIME Community Hub spaces with the tag JKISeason2-xx, where xx was the number of the challenge.
By counting the tags, we ranked users on our leaderboard and ended up with ten at the top, who solved all the challenges – more than twice the number we got last season. Without further ado, let’s celebrate our newest top KNinjas:
- Naoyoshi Yamamoto: Fast execution of error handling & logging
- Hiroki Yoshida: “Ask me anything” workflow with OpenAI’s GPT-3 models
- Luo Yuxi: SHAP loop explains per capita crime rate predictions
- Heather Lambert: Making a video on football passes with KNIME
- Ryushi Seo: A multi-language, customized music data app
- Anil Kumar Sharma: Expanding menu languages in a data app with automated translation
- Bertold Balázs: Parameter optimization loop to improve classification performance
- Artem Ryasik: BERT embeddings and SpaCy for sentiment analysis
- Li Jiehui: Uncovering relationships between real estate indicators and crime rate
- Ángel Molina: Geospatial analytics for visualization of routes and cities
Naoyoshi Yamamoto: Fast execution of error handling & logging
(KNIME Forum: tyousuke, X: @obito_od)
Naoyoshi works in drug discovery research at the Toray Industries pharmacology laboratory in Kamakura, Japan. Besides being in charge of pharmacology, he also manages databases related to drug discovery research. As a certified Senior Leader in their in-house digital skills certification system, Naoyoshi also conducts KNIME dissemination activities with the goal of improving the digital skills of his field personnel.
Selected Just KNIME It! Challenge
Naoyoshi’s solutions to our challenges this season are extremely well-documented (often in English and Japanese) and efficient. Together, we selected Challenge 17 as a good representation of his work. This challenge was on error handling and logging techniques for better workflow development, which Naoyoshi had never thought of doing in KNIME. He approached the problem with a fresh mindset, and used a benchmark to make sure that his solution executed fast enough.
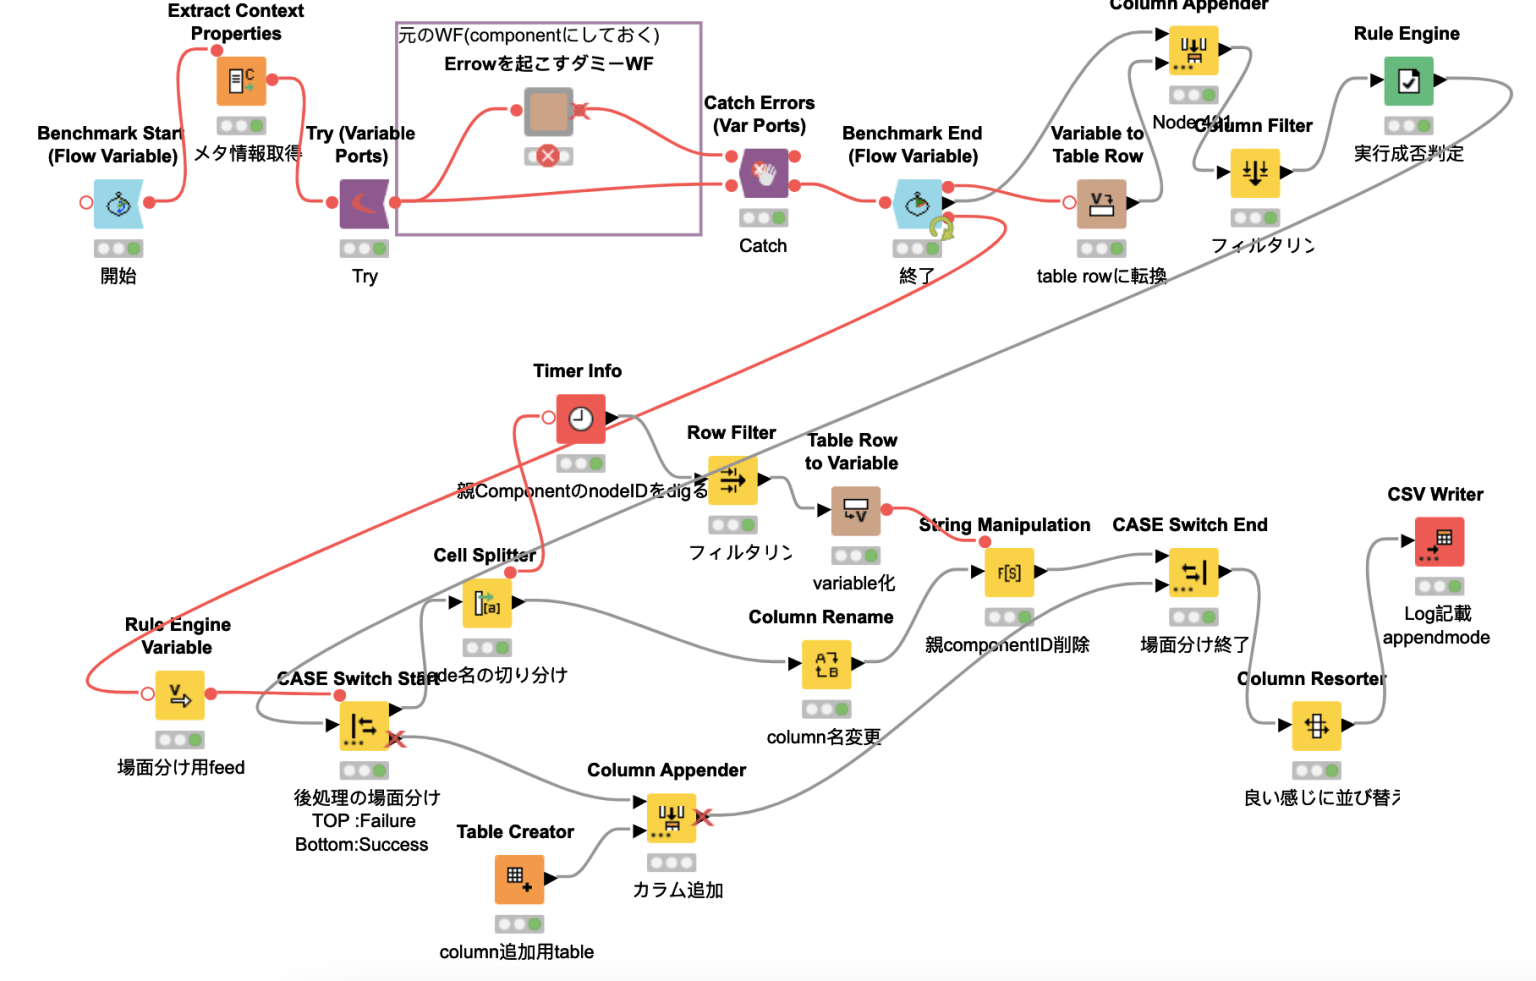 A screenshot of Naoyoshi’s final solution to Challenge 17. His solution is robust and includes the implementation of a benchmark.
Hiroki Yoshida: “Ask me anything” workflow with OpenAI’s GPT-3 models
(KNIME Forum: corgikenhouse, LinkedIn: Hiroki Yoshida)
Hiroki works for a startup company in Kyoto, Japan, focusing on RNA-targeted small molecule drug discovery. His responsibilities extend beyond compound design and synthesis to also encompass regular data analysis and chemoinformatics. In his spare time, Hiroki enjoys creating stickers for LINE, one of the most popular chat tools in Japan, related to niche areas like DNA and other topics in organic chemistry and molecular biology.
Selected Just KNIME It! Challenge
Hiroki started using KNIME Forum in the beginning of this Just KNIME It! season. It was great to see how his workflows evolved and how he interacted with other users to clarify questions and get feedback. He told us that KNIME’s exceptional readability made him learn a lot about how machine learning can be used in workflows. “What stood out the most to me was the ability to add annotations and create clean workflows, which made it very easy to understand and analyze them. It has proven to be very useful in streamlining thought processes,” Hiroki says.
A great example of Hiroki’s work this season is his solution to Challenge 11, which asked users to build a workflow that answered natural language queries (for example, “What is KNIME?”). Hiroki integrated KNIME with one of OpenAI’s GPT-3 models and came up with an interface that was very robust. It even got tested by other users in KNIME Forum. Hiroki did not know that it was possible to integrate KNIME with application programming interfaces (APIs) such as GPT-3 models and found it very simple. He was also very happy with how rapid and supportive the KNIME team was at testing his solution and giving him feedback.
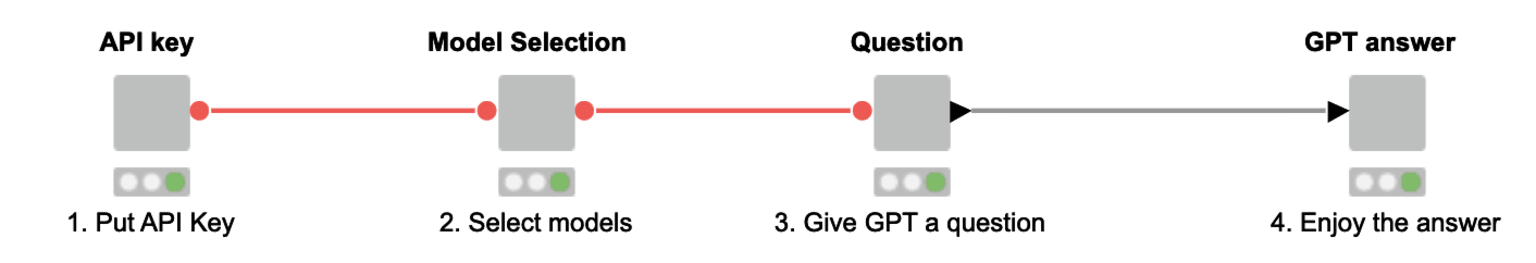 Hiroki’s solution to our GPT-3 challenge is very flexible, accepting different API keys, model selection, and then finally passing questions to GPT. The answers are displayed as a clean table view.
Luo Yuxi: SHAP loop explains per capita crime rate predictions
It is not the first time that we have the pleasure of awarding Luo. In fact, he was our Contributor of the Month this past August. Besides being an avid KNIME Forum participant, Luo has contributed a lot to the Chinese-speaking KNIME community, authoring a book in Chinese on KNIME visual data analysis. More recently, he also started translating Just KNIME It! challenges into Chinese, along with his polished and detailed solutions. Luo works as a data analyst and software developer, proving that low-code is an increasingly important paradigm for all careers in tech.
Selected Just KNIME It! Challenge
Luo is an expert in didactics, and his solutions are clean and easy to follow. He told us that his favorite challenge this season was Challenge 13, which asked users to experiment with xAI to understand connections between crime and real estate in Boston, Massachusetts, in the United States. Luo’s solution, which came with an incredible accompanying blog post, detailed how to use a SHAP loop to derive explanations for each predicted “per capita crime rate”. It also showed how a dependence plot clarifies the connections between these predictions and a variety of real estate features. Luo enjoyed the different approaches that users took to solve this challenge. In the end, all participants learned something new about xAI with this puzzle.
 Left is Luo’s solution to Challenge 13. He used the SHAP Summarizer node to summarize the test data into n prototypes, and then used a SHAP loop to generate “per capita crime rate” (CRIM) predictions to each of them. On the right you can see the part of the visualization generated by Luo with instances of the dependence plot node. The plot shows how the real estate feature "average number of rooms per dwelling" (RM) relates with CRIM values.
Heather Lambert: Making a video on football passes with KNIME
(KNIME Forum: HeatherPikairos, Website, LinkedIn: Heather Lambert)
Heather’s story is interesting: this KNinja had not really used KNIME much until 2023, but now she is an expert. Her stellar journey with us comprises not only detailed solutions to our challenges (including videos), but also a lot of data science upskilling in cheminformatics, which she discussed extensively in a recent My Data Guest interview. By day, Heather works full-time as a cheminformatician for Pikaïros, primarily with KNIME and Python.
Selected Just KNIME It! Challenge
Heather really went the extra mile to explain her solutions to other users in KNIME Forum, and even created didactic videos to showcase her insights. A great example of her work is Challenge 7, in which users were asked to map successful football passes using visualization techniques. This KNinja created much more than just a static map: using a chunk loop, she created different images for different input data rows, merged them, and generated a video for the football passes with KNIME. Everybody in the thread got excited and started giving feedback to one another. It was beautiful to see the impact of her solution!
 Excerpt of the video on football passes generated by Heather with KNIME Analytics Platform.
Ryushi Seo: A multi-language, customized music data app
(KNIME Forum: sryu, LinkedIn: Ryushi Seo)
Ryushi is a product engineering manager at Xeureka Inc., a company in Japan focusing on drug discovery. This KNinja is not new to low-code: in his previous career, he built an AI drug discovery platform using KNIME. As for Just KNIME It!, Ryushi started sharing his expertise in the KNIME Forum during our first season, but this year, his contributions really shone. He created clean data apps even for challenges that did not explicitly ask for them, underpinning the importance of a good interface in data science applications.
Selected Just KNIME It! Challenge
Ryushi’s visualizations really caught our attention, and his solution to Challenge 30 is a great example of that. This open-ended problem involved creating a data app relating music artists and their production. This KNinja gifted us with a great example of view customization. By playing with the Table View node’s color schemes, he ended up with a legible and nice-looking display for the top artists in the given data.
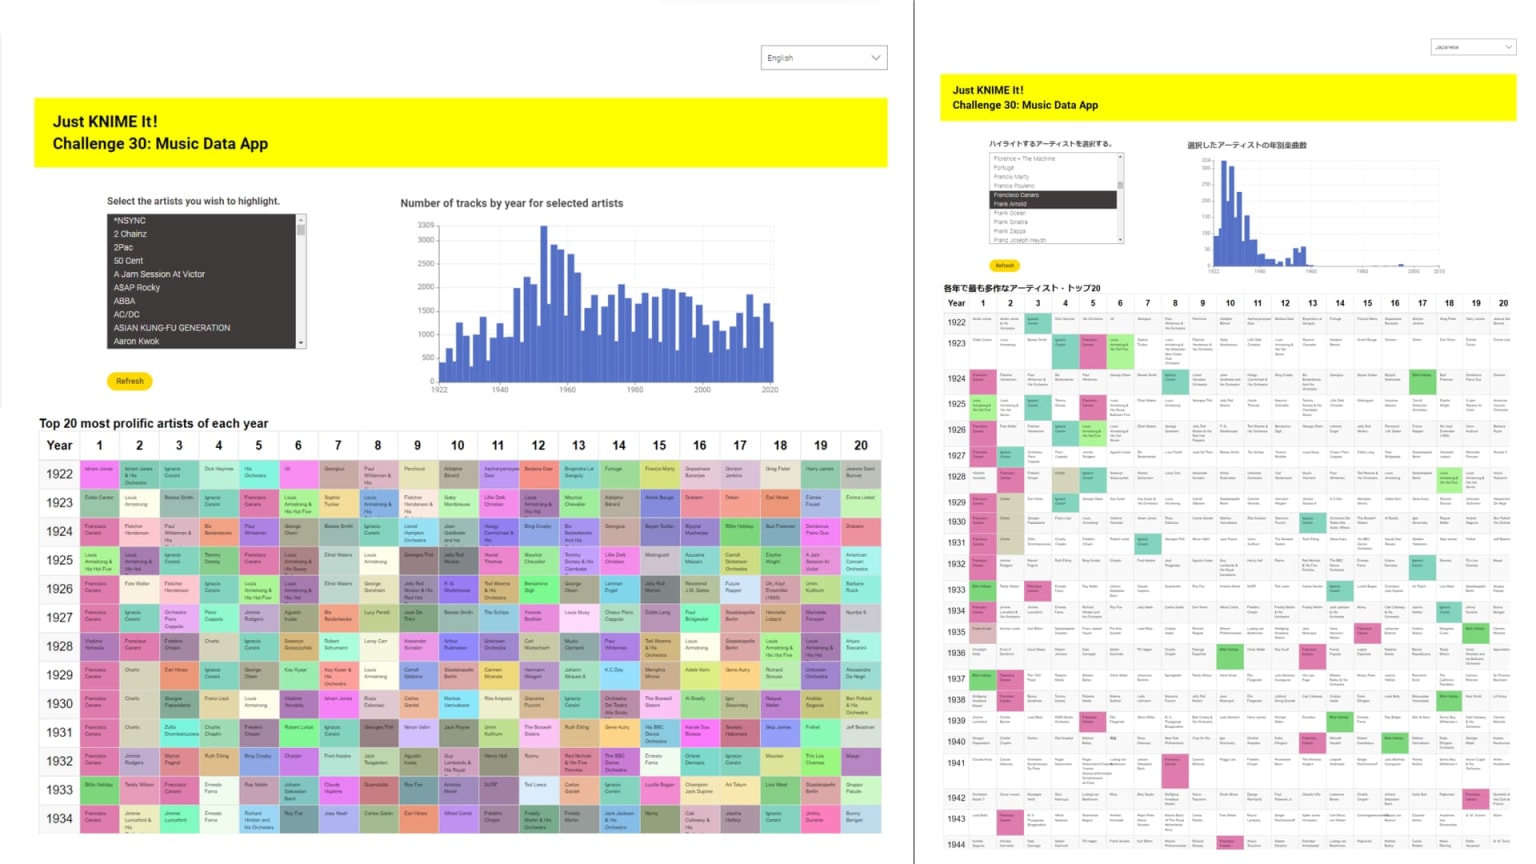 Data app created by Ryushi for Challenge 30. He created a color scheme that facilitated the interpretation of the artists’ production.
Anil Kumar Sharma: Expanding menu languages in a data app with automated translation
(KNIME Forum: AnilKS, X: anilsharma2910)
Anil is our first user to be nominated a top KNIME KNinja in both Just KNIME It! seasons. This challenge veteran is the deputy general manager of purchasing at Dabur India Limited, where he usually deals with large amounts of structured and unstructured data, in addition to being responsible for the execution and evaluation of various supply management processes. Anil’s workflows are concise and efficient, and hence very readable for KNIME users of all levels. His contributions to our community, which showcase how KNIME can be used for different data-centered tasks, made him a Contributor of the Month last year.
Selected Just KNIME It! Challenge
This season, Anil’s workflows received much praise in the KNIME Forum, where he was quick to provide insight and feedback to other users as well. His solution to this season’s Challenge 30 (data app on music, involving menus in different languages) is a great example of conciseness and good user interface, but also makes a case for reuse and collaboration. He leveraged a translator component built by our team to include Arabic in the language menu of his data app!
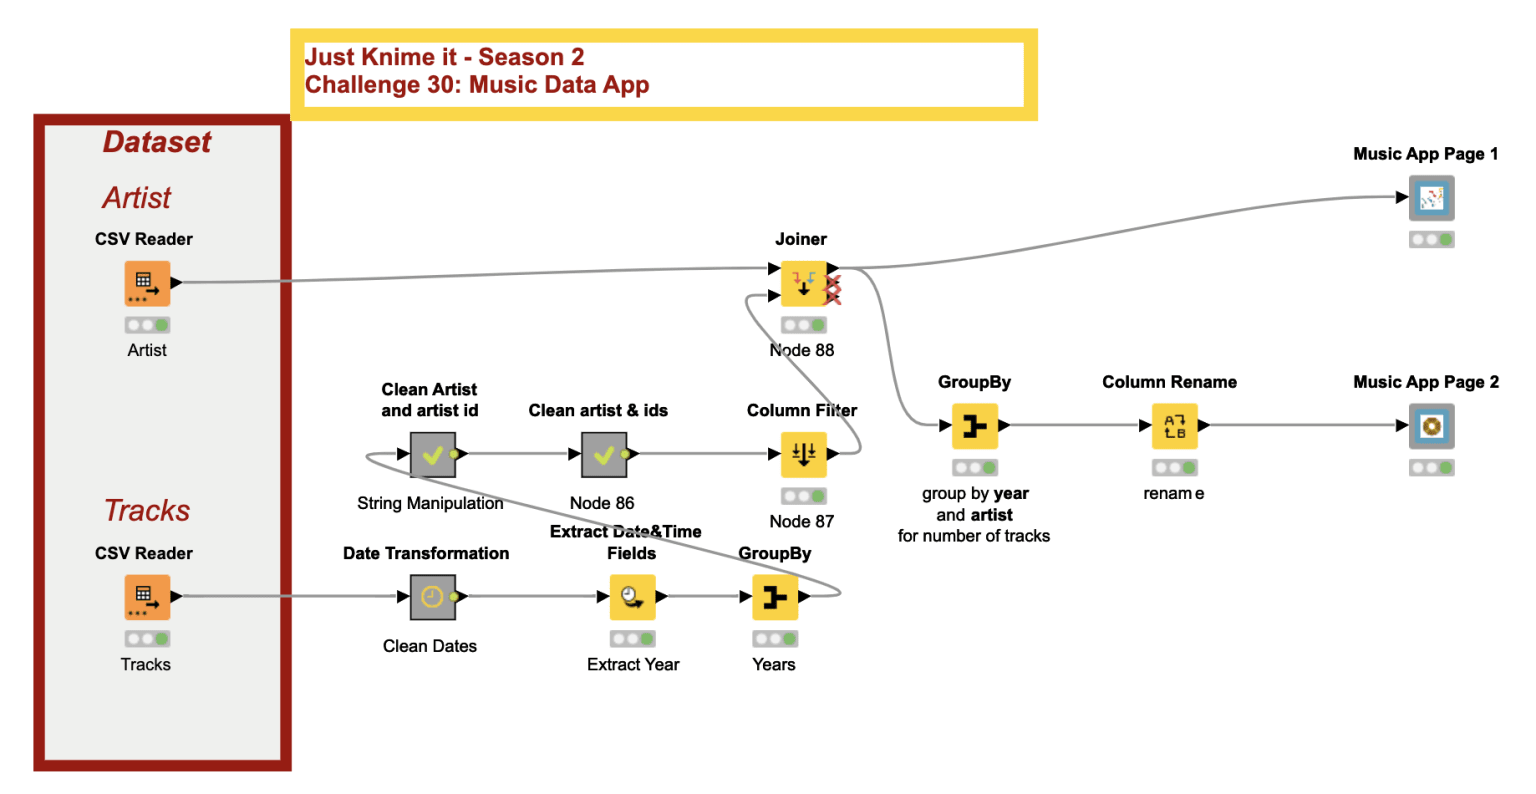 Anil’s solution to Challenge 30. Note how he designed a data app with two pages, likely already thinking of how it could be deployed as a complex data app.
Bertold Balázs: Parameter optimization loop to improve classification performance
(KNIME Forum: berti093, LinkedIn: Bertold Balázs)
Bertold, on a search for fun KNIME problems, stumbled upon Just KNIME It! early on in our first season. He became a regular at tackling our weekly puzzles, and his solutions became more and more streamlined with time. This season, Bertold did not miss one single challenge, and told us that he learned a lot about parameter optimization, image recognition, and data app building. By day, Bertold is a management consultant working for IFUA Horváth in Hungary, using KNIME daily to implement decision support solutions and business intelligence roadmaps. He likes KNIME so much that he even uses it to look for good online deals for his wife. Maybe searching for online deals could be the theme of a future Just KNIME It! challenge?
Selected Just KNIME It! Challenge
Since Bertold learned so much about data science through Just KNIME It!, we thought it would be cool to select a workflow that, according to him, taught our KNinja something new. Challenge 25 was on the detection of heart disease, and we asked users to experiment with parameter optimization. It was the first time that Bertold used the parameter optimization Loop nodes, and his concise solution correctly optimized hyperparameter values for optimum F-measure. Until then, he did not know that this was possible with KNIME!
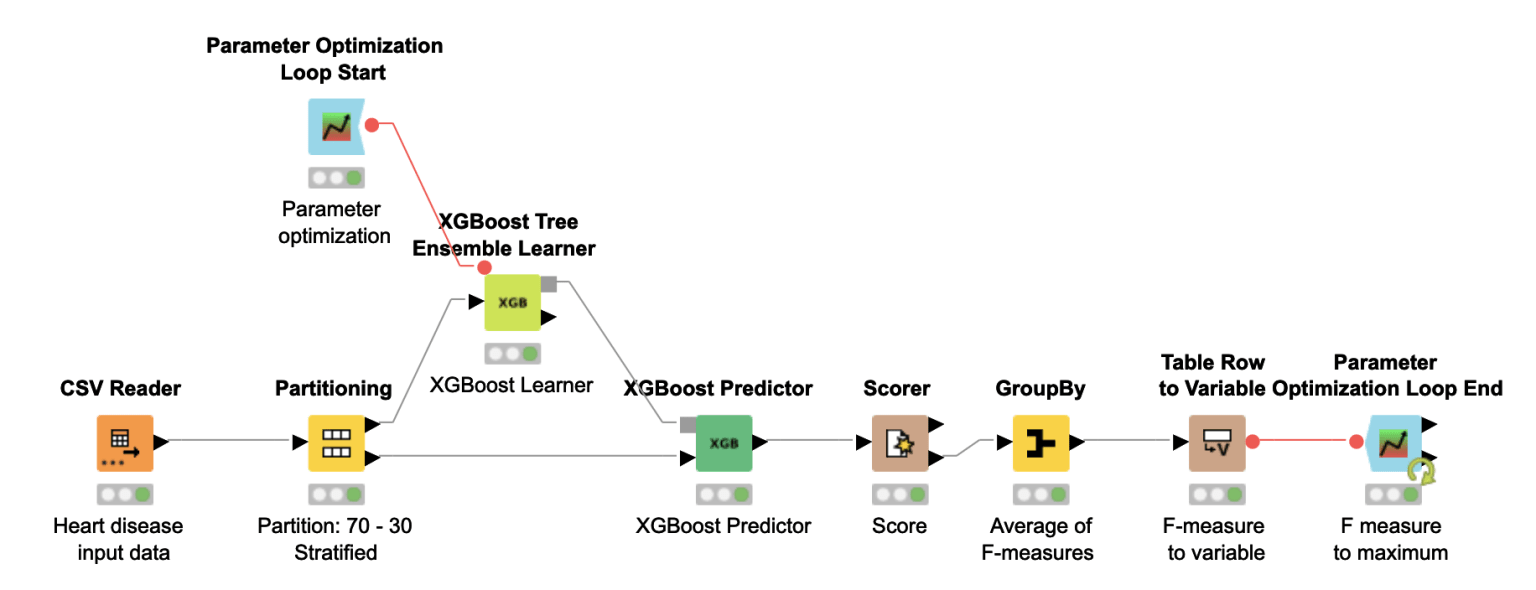 A concise and well-described workflow by Bertold, showcasing how simple it is to optimize parameter values with KNIME Analytics Platform.
Artem Ryasik: BERT embeddings and spaCy for sentiment analysis
(KNIME Forum: Artem, LinkedIn: Artem Ryasik, Website)
Artem is an Advanced Analytics Engineer with a solid technical background, specializing in natural language processing (NLP), anonymization, and graphs. He has contributed to KNIME for years, especially by developing KNIME nodes at Redfield AB (check some of the Redfield extensions here), and by teaching KNIME (Artem is a KNIME Certified Trainer). This KNinja already got nominated as Contributor of the Month, and now we are happy to celebrate him again for his work during Just KNIME It!
Selected Just KNIME It! Challenge
Artem’s solutions are particularly special for their technical depth. This KNinja added bonuses to some of his challenges, including conformal prediction to evaluate how certain a model was of its predictions. He often took the time to explain his workflows in the KNIME Forum, and also gave great examples of collaboration by reusing parts of other users’ solutions, or by providing them with feedback.
Challenge 6 was on sentiment analysis and text processing, and Artem’s solution really stood out. Instead of relying on the components we provided to facilitate the challenge, he experimented with two different approaches “from scratch:” BERT embeddings and a combination of spaCy functionalities with conformal prediction. He also took the time to explore parameter optimization, and this encompassing workflow (which is also well-documented) had a lot of KNIME Forum users learning new techniques.
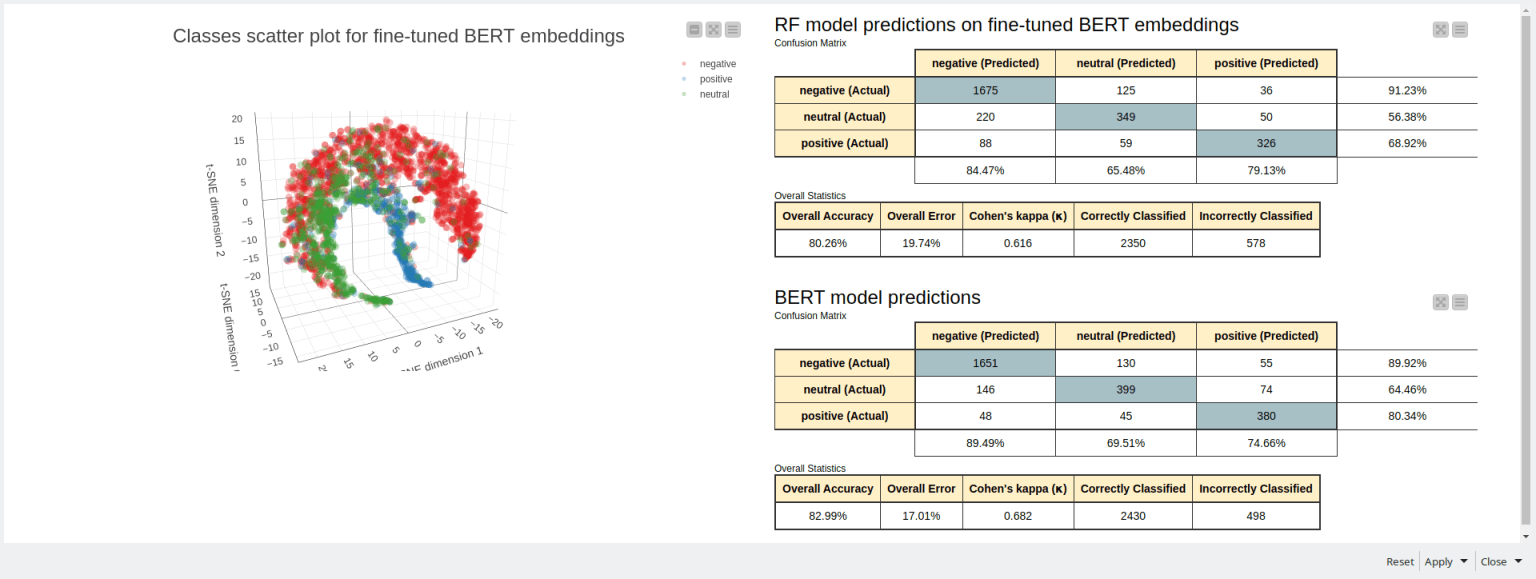 Part of Artem’s dashboard to visualize sentiment predictions generated with BERT embeddings.
Li Jiehui: Uncovering relationships between real estate indicators and crime rate
(KNIME Forum: tomljh)
Always attentive to detail, Li often came up with more than one solution to our challenges this season. It was not uncommon to see this KNinja take his time to post and explain more than one of his approaches to our puzzles. His solutions are concise and well-documented (sometimes both in English and Chinese), making them a great resource for those who want to use Just KNIME It! to start learning KNIME. As the season kept moving, Li’s solutions kept getting more refined, which was maybe a consequence of his fruitful exchanges in the KNIME Forum. Li used to be an application software development engineer, but now prefers to work with data analysis. In his spare time, he enjoys using KNIME to experiment with unfamiliar data-centered problems and techniques.
Selected Just KNIME It! Challenge
We talked to Li and he really enjoyed this season’s challenges on XAI and data engineering. His take on Challenge 13, which focuses on potential relationships between real estate indicators and crime rate in Boston, is a great example of his didactic way of sharing his insights with others. He also did a great job at reusing part of a KNIME example workflow, ending up with a solution that offered two approaches to the problem: one based on SHAP, and one based on scatter and conditional box plots.
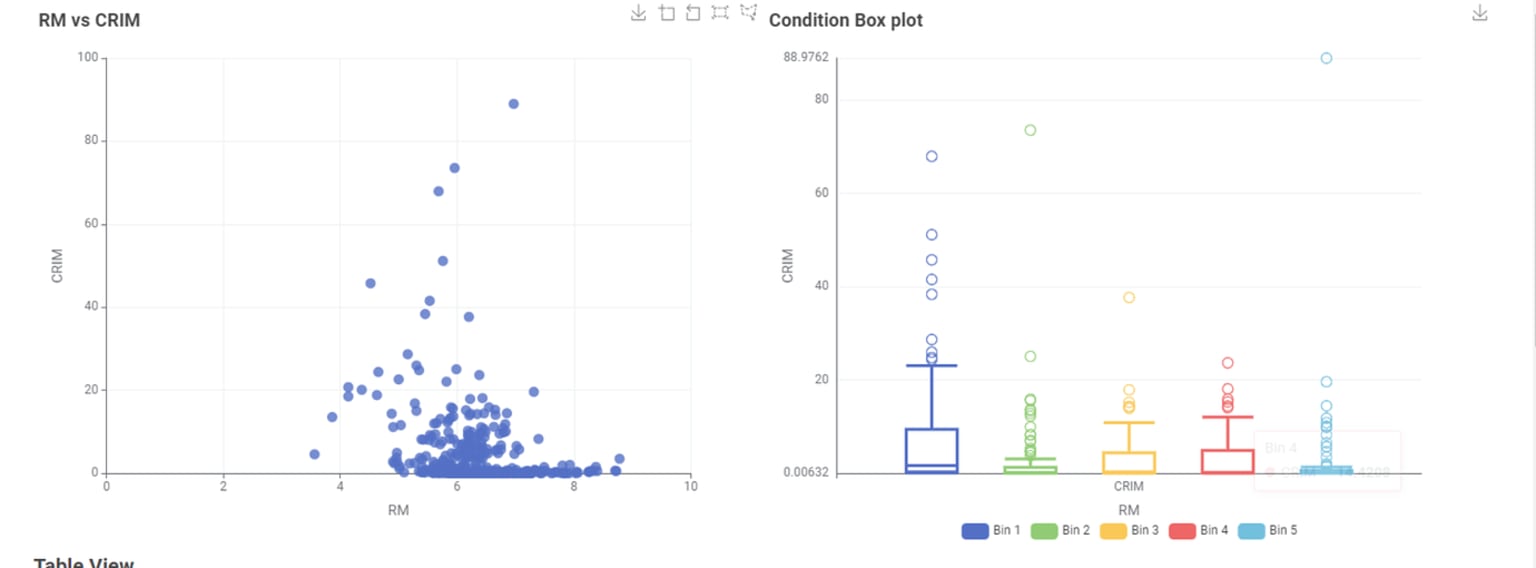 Visualizations from Li’s simpler solution. When the number of rooms in a house (RM) is small, the corresponding median of the crime rate gets slightly larger.
Ángel Molina: Geospatial analytics for visualization of routes and cities
(KNIME Forum: MoLa_Data, X: MoLa_Data, Linkedin: Ángel Molina Laguna)
Ángel is a champion advocate for KNIME in social media and beyond, and is yet another KNinja who has previously been selected as Contributor of the Month. Besides being very committed to Just KNIME It!, Ángel often posts short educational videos and funny visuals on his profiles, and recently started a newsletter to share his knowledge on data science and visual programming (including KNIME!) with the Spanish-speaking community. Ángel works as a data science and analytics consultant and is also a KNIME Certified Trainer.
Selected Just KNIME It! Challenge
Ángel’s solutions are very involved and well documented, and often have interesting visualizations or interactive dashboards. One of them was so complete that it even got published in the Low Code for Data Science journal: his solution to Challenge 18, in which we asked users to visualize their favorite places on a map. Ángel used many nodes from the geospatial analytics extension for KNIME, and did a great job at detailing how they work. Although this challenge does not use machine learning, this KNinja told us that learning more about this field was one of his favorite parts of Just KNIME It!
Taking it all in
Congratulations to our newest generation of KNIME KNinjas! Your solutions to our challenges highlight different functionalities of KNIME Analytics Platform, and are great examples of how much data science and data analytics can be effectively implemented with low code.
Your enthusiasm and collaboration in the KNIME Forum gets us excited about hosting the next Just KNIME It! challenges. Read more about the Just KNIME It! data challenges and when the next series of challenges kicks off.