KNIME's Open Ecosystem
Leverage an ever-growing library of extensions, join the global community, contribute to data-driven innovation.
Take advantage of the open ecosystem by leverage
KNIME’s thriving community of data scientists and developers regularly contribute extensions expanding KNIME’s ecosystem with custom capabilities. Browsing KNIME extensions on KNIME Community Hub, you’ll find dozens of contributions, spanning from industry-specific to sophisticated scientific software integrations.Extensions provided by KNIME
Choose from a wide range of extensions developed by the KNIME team for integrating specific functionality like text processing or geospatial; connecting to your favorite data warehouses or lake, third party application, popular machine learning libraries, and more.
Extensions provided by technology partners
KNIME’s platform is used in hundreds of use cases across many areas in organizations – in many cases, our partners supplement with their own domain or tool-specific integrations. All partner contributions are vetted by the KNIME team.
Extensions provided by our community
Data science is a fast moving field with a lot of experimental technology, regularly added and deprecated from data professionals’ toolbelts. Our community members regularly add new features and tech that is not yet widely adopted. Leverage a trusted extension that’s vetted by KNIME, or an experimental extension to tinker with new technology (in these cases, backwards compatibility is not guaranteed).
Want to create your own Extension?
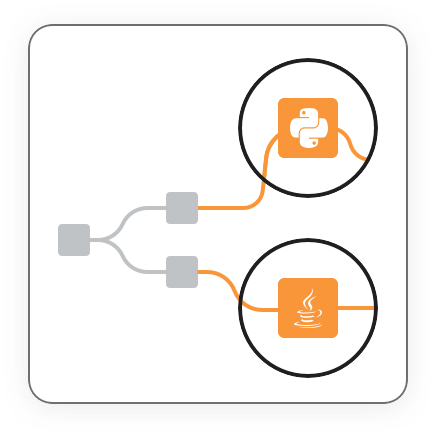
A KNIME extension is a set of nodes with custom capabilities, either integrating existing technology or implementing something entirely new and making it available as a no-code solution to everyone through the KNIME Analytics Platform. Extensions can be developed in Java, Python, or both.How can I create a KNIME extension?

How can I make my extension available to others?
If your extension requires an additional (commercial) license to be functional or is licensed under a non-open source license, get in touch with our partner team to learn about becoming a KNIME Technology Partner.

FAQ
Community extensions are released with an open-source license, whereas a partner extension is either licensed under a non-open source license or requires an additional license of a third party tool to be functional.
- The differences are the characteristics of a trusted extension:
- All nodes are tested
- Compliance with our noding guidelines
- No known security issues
- Active maintenance for the last two feature release versions of the KNIME Analytics Platform
- Backwards compatibility: the test workflows and also the nodes in existing workflows behave in newer versions just as they did in older versions
Have a closer look at our guide.