
A poor credit score can ruin an individual’s prospects for economic mobility, tarnishing their chances at buying a house, a car, or an education. At scale, disadvantageous credit scoring can widen the wealth gap and leave behind entire social classes.
So taking extreme measures to make the process transparent is one of the most important responsibilities of a banking institution.
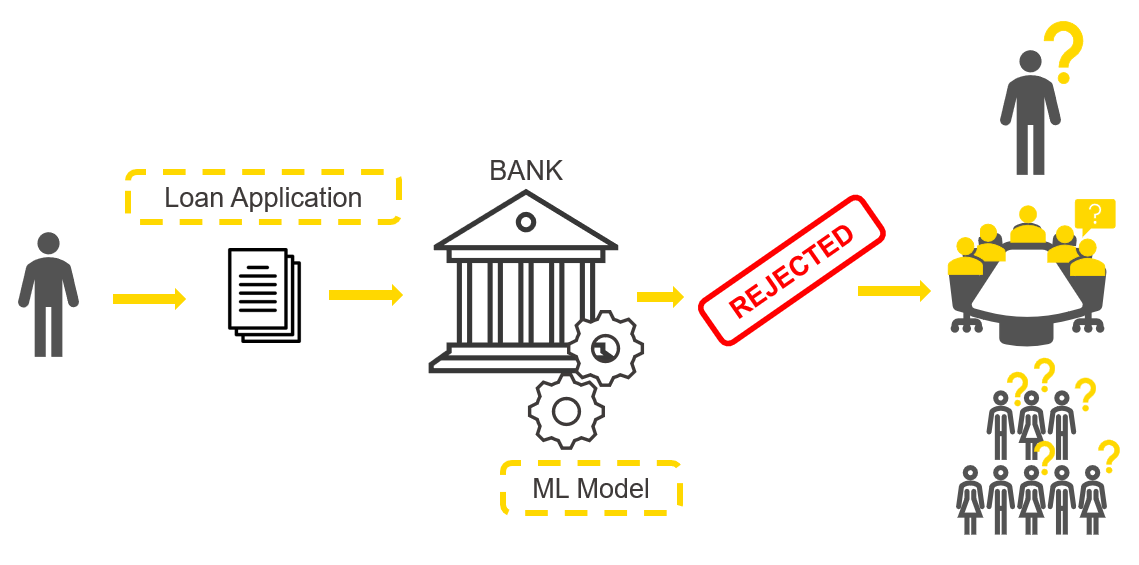
Explaining Predicted Risk on Loan Application
Every bank uses credit scoring to determine whether a loan application should be accepted or rejected. Recently, more and more banks are considering adopting machine learning to compute credit scores. This approach should, in theory, deliver better performance than traditional methods - but it generates a model which is hard to explain. It’s imperative for banks using this ML approach to understand why their models are making these life-altering decisions.
This article will run through an example of a credit scoring machine learning model, and how we can use XAI methods to know how the model computes those outcomes.
First, let’s define what the machine learning model is doing. Credit scoring basically means to score or classify loan applicants based on information such as their credit history. If the outcome is positive the bank might grant the loan, if it is negative, the bank rejects it.
The dataset, downloaded from Kaggle, has historical data on loan applications. A binary target, creditworthiness, indicates whether an applicant was creditworthy or risky and ten features contain information about demographic and financial characteristics of the applicants (Fig. 1).
Neural networks are machine learning model categories that tend to perform well in many tasks but are black boxes: they are not interpretable given their complexity. We trained a simple neural network to predict creditworthiness.
In order to explain this model, we applied various post hoc explanation methods. These methods are designed to explain complex models that achieve high performance, and therefore, keep the performance and still achieve some interpretability.
Once those XAI methods return results explaining the black box model, we need to focus on what comes afterwards, which is often underestimated in the XAI field: visualizing in intuitive and interactive views the model explanations via charts and captions. Using guided analytics, we can guide the domain expert step by step through a data app via any web browser. Once the data apps are deployed, domain experts, in our case bank employees, can easily access the XAI results, without needing to install any desktop data science tool.
Global Feature Importance
Let’s start with explaining the global behavior of the credit scoring model and answer the question:
Which features are globally the most important for the model?
By “globally” we mean that on average across all predictions we want to find the most important features and also quantify and ranke this importance. The methods adopted here are Global Surrogate Models and Permutation Feature Importance.
In the animation below (Fig. 2), on the left side of the interactive view, you can find the brief descriptions of the adopted global feature importance techniques explaining how they were computed. On the right side, you can see the global feature importance visualized in most cases as a horizontal bar chart: each bin indicates the importance of a feature. For the surrogate decision tree the interactive view visualizes the actual diagram of the tree, where the most important features are visualized close to the root of the tree.
Read more about this interactive view in the KNIME Blog in the article Understand Your ML Model with Global Feature Importance.
So to answer our question as to which features are globally the most important for the model?
In this case, we received quite consistent results: according to the four applied techniques, the most important features are: “Times in Debt for 1-2 Months”, “Times in Debt for 2-3 Months”, and “Times in Debt for 3 Months or More”. Therefore, one general explanation (and recommendation) from a bank could be - don’t get debts! Quite obvious of course.
Local Explanation View
Now let's move to the next view and the question we want to answer is:
What should the applicant change to get approved by the bank?
In the animation below (Fig. 3), we can see the interactive view which contains the information about the data point of interest (in our case the rejected applicant). At the top of the view, a table is displaying the original instance with its feature values and the predicted class. On the left, a bar chart shows local feature importance. On the right, the tile view displays one card for each counterfactual found for this prediction.
What should the applicant change to get approved by the bank?
Compared to the applicant of interest, the created counterfactuals applicants, predicted as creditworthy, earn more and never had debts in the past. While the debt history cannot be changed, the applicant can try to increase monthly income in order to get approved by the model. You can read more about Global Feature Importance in the article, Understand Your ML Model with Global Feature Importance.
Read more about the Local Explanation View in the article, XAI - Explain Single Predictions with a Local Explanation View Component
XAI View
Three more techniques we want to demonstrate are Partial Dependence Plot (PDP), Individual Conditional Expectation Plot (ICE), and SHapley Additive explanation (SHAP).
In this view we want to explain 4 predictions and answer the following question:
How is the feature “Times in Debt for 3 Months or More” used by the model over all the visualized predictions?
In the animation below (Fig. 4), we investigate the feature “Times in Debt for 3 Months or More” for four instances of interest using PDP, ICE, and SHAP. We can interactively select another feature or explain way more than only 4 instances, but for education purposes we are going to focus on this simpler use case: 1 feature and 4 instances.
How is the feature “Times in Debt for 3 Months or More” used by the model over all the visualized predictions?
Given the high variance in SHAP values which are never close to 0 and the inverse proportionality in the PDP curves, we can tell this feature is used more than any other feature to determine both risky and creditworthy prediction for these 4 applicants. Please notice the above cannot be generalized to every prediction the model would make.
Read more about the XAI View in the article, Debug and Inspect your Black Box Model with XAI View
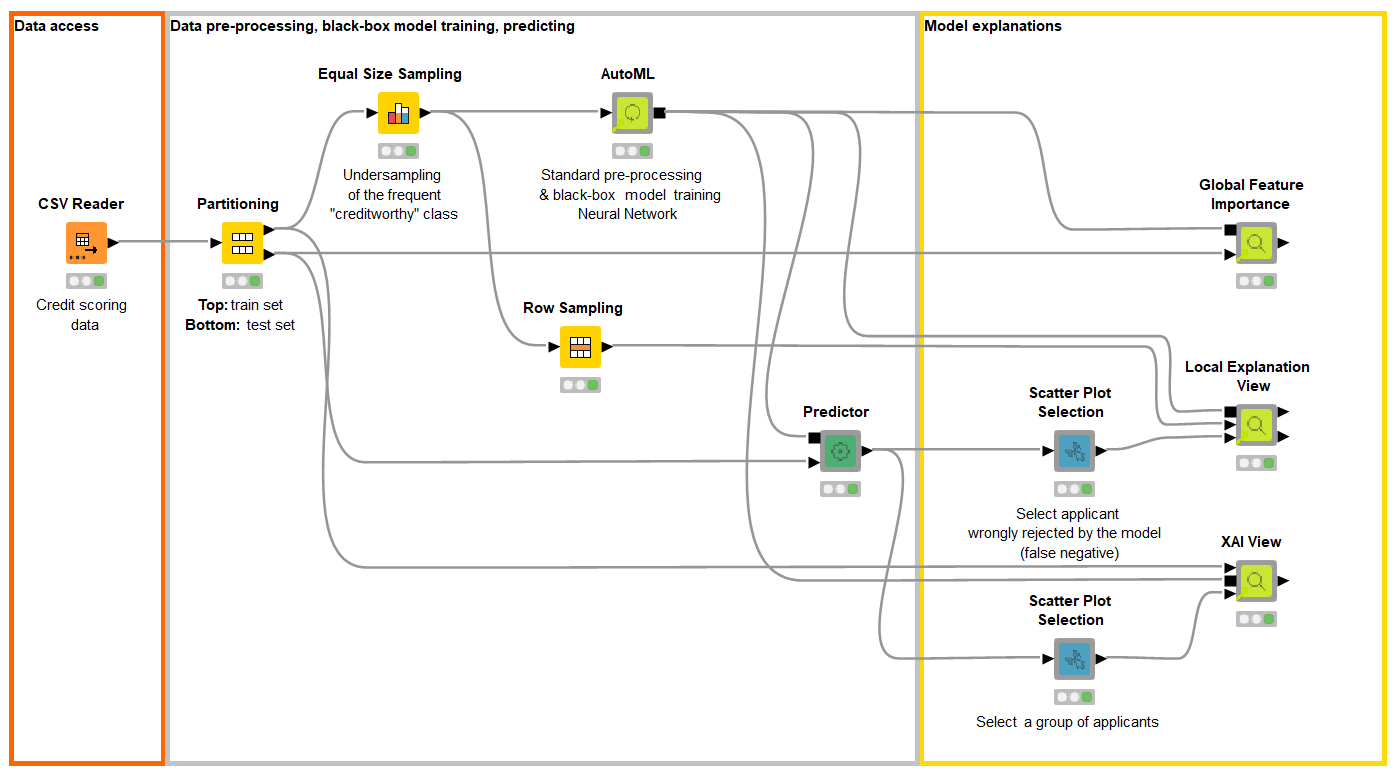
Everything in a Single KNIME Workflow
The interactive views were created in the free and open source KNIME Analytics Platform with a single workflow (Fig. 5). No Javascript or Python was adopted to build those views or train the models. Those demonstrated techniques and interactive views are additionally packaged as reusable and reliable KNIME Components built without coding to work with any classifier trained on any dataset.
We explored three interactive views with XAI techniques implemented with visual programming. KNIME Analytics Platform offers a user-friendly way and a machine learning framework to build and customize such views. Although it is now easier to build such visualizations, via visual programming instead of pure coding, each XAI technique offers advantages and disadvantages.
Explainable AI Resources At a Glance
Download the workflow and components from the KNIME Hub that are described in this article and try them out for yourself.
- Explaining the Credit Scoring Model with Model Interpretability Components (workflow)
- Global Feature Importance - Try the component and read the related blog article
- Local Explanation View - Try the component and read the related blog article
- XAI View - Try the component and read the related blog article