
Surveys are great tools to get to know and understand your audience. They can be used to reach a variety of goals - place a product, review a service, conduct a study, measure satisfaction… they are so versatile that I bet you used (or thought of using) them at least once!
But the real value comes when the responses of the survey are analyzed in a meaningful way to extract and gain insight. For the purpose of this blog post we’re using some commonly adopted tools to conduct a survey, collect responses, and analyze the data with KNIME Analytics Platform:
- Google Forms to conduct the survey
- Google Sheets to collect the answers
- KNIME Analytics Platform to analyze and present the insights derived by the survey
To demonstrate how you can extract the responses from a Google Form analysis and import them automatically into KNIME Analytics Platform, I have created a little survey myself, about the usage of KNIME and the user satisfaction. The survey so far has just run internally, with a small sample of KNIME users. Therefore, the results of the survey at this point are not meant by any means to provide meaningful insights.
The goal of this blog post is rather to show you how such insights can be automatically extracted and presented from the Google Form to a report in KNIME Analytics Platform.
Of course, this will be a work-in-progress kind of blog post. I will provide regular updates on the results, as new responses come in. If you would like to contribute to the KPIs in the final report, you can fill out my Survey about using KNIME form.
Disclaimer: The survey is not meant to be an analysis of the KNIME status. The responses are collected solely for the purpose of this blog post as an example to demonstrate the process of collecting, extracting and using them. Responses are anonymous and public and are not used by KNIME for different purposes.
The Survey Platform - Google Forms and Google Sheets
Google Forms is a web application to administer surveys. It offers basic built-in functionalities, which - although limited - help to easily create effective surveys. Participants can access it via a sharable link, and the responses are collected in a Google Sheets document. Both those services are part of the Google Docs Editors suite and therefore free to use with a Google account.
Google Forms already offers a simple Google Form analysis tool, suitable for a quick overview. However if we want to dig a bit deeper and get more knowledge out of the responses, KNIME Analytics Platform offers more options. Using KNIME software to perform a Google Form survey analysis gives us complete control of the data to carry out all the preprocessing steps including data cleaning and missing values handling. Multiple answers can be split and handled individually. Answers to different questions can be combined to perform a cross tabulation analysis. We can choose among a wide range of customizable plots to present the results, as shown later in this article.
In particular, KNIME Analytics Platform offers a set of nodes, the KNIME Google Connectors nodes, to easily connect to the Google Suite and retrieve the responses of the survey stored in the Google Sheet. After that, Google form data analysis the data within KNIME will be a piece of cake (Remember How to Create an Interactive Dashboard in Three Steps with KNIME Analytics Platform? There we’ve performed a visual exploration of a dataset with little effort and put together a dashboard with the plots).
The Goal of the Survey
The idea is to run a survey among KNIME users to understand how they use the software, what they like about it, and how they started using it. Simple enough to be quick to do, interesting enough to have some fun with the results.
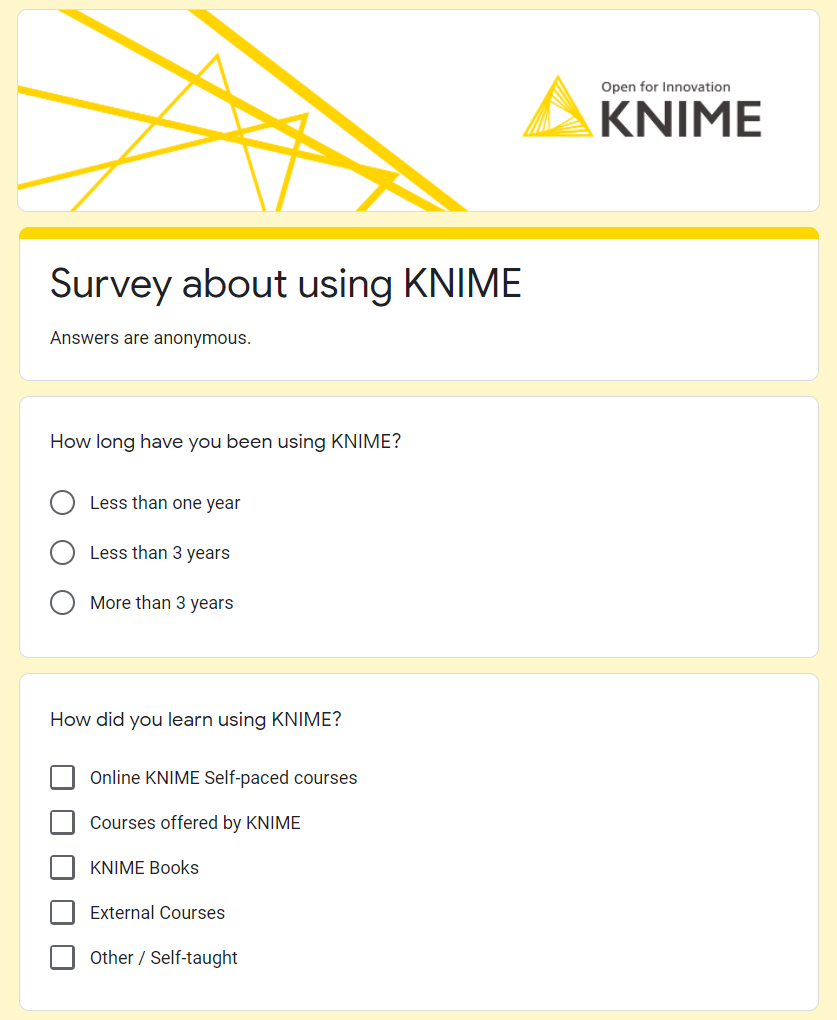
Google Forms offers the possibility to choose different types of questions: multiple choice with radio buttons, checkboxes, scales, grids, raw text… In the survey, we inserted a mixture of questions that will require different processing during the Google Form survey analysis.
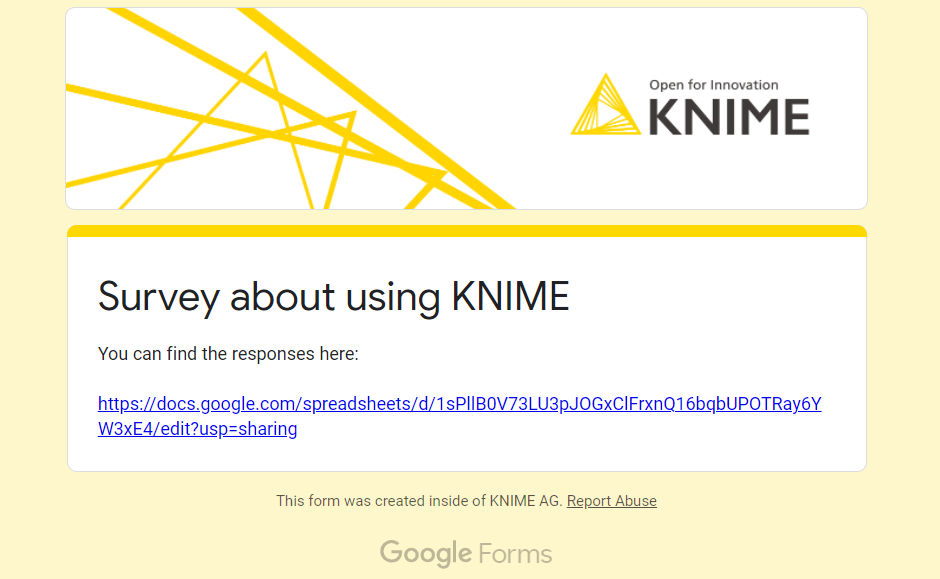
If you want to try it, fill in the form here. Answers collected with the Google Form are then made public. You can add the Google sheet with the responses collected so far to your Google scope. After filling in the form, the landing page, shown in Fig. 2 and containing the link to the Google sheet, will appear. Just open it while logged in with your Google account. This will add the Google sheet to your “Shared with me” space and will make it available for the next steps.
It is helpful to remember that the answers do not contain any specific user information.
Get Survey Reponses and Analyze
Let’s now move into KNIME Analytics Platform to collect the responses, calculate the KPI, and display them into a report so you can conduct you Google Form survey analysis.
In this section we'll take a closer look at how to analyze data from Google Forms. Topics covered include retrieving the response texts saved in the Google Sheet and making them available into KNIME Analytics Platform.
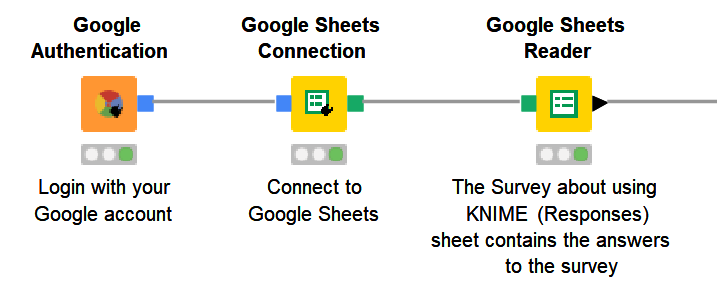
As shown in Figure 3, this simple process only requires three nodes:
- Google Authentication node, to login into Google with your Google Account
- Google Sheets Connection node, to interface with the Google Sheet service
- Google Sheets Reader node, to select the spreadsheet to read.
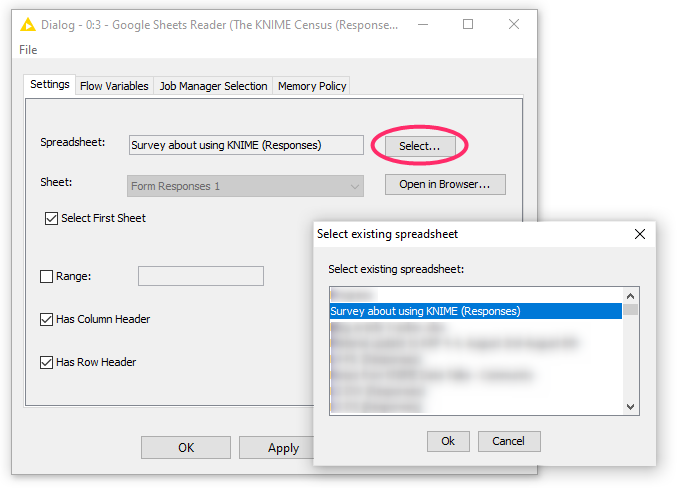
In the latter, we select the “Survey about using KNIME (Response)” spreadsheet. If you have opened the link at the end of the survey while logged in, it should be visible in the menu for the “Spreadsheet” option in the node configuration window.
Executing the previous nodes will bring all the survey’s responses into KNIME Analytics Platform. Now, it’s the time to shine. Let’s elaborate on some of the questions.
Note: We have only run this survey internally so far - so all the responses you see are from KNIMErs.
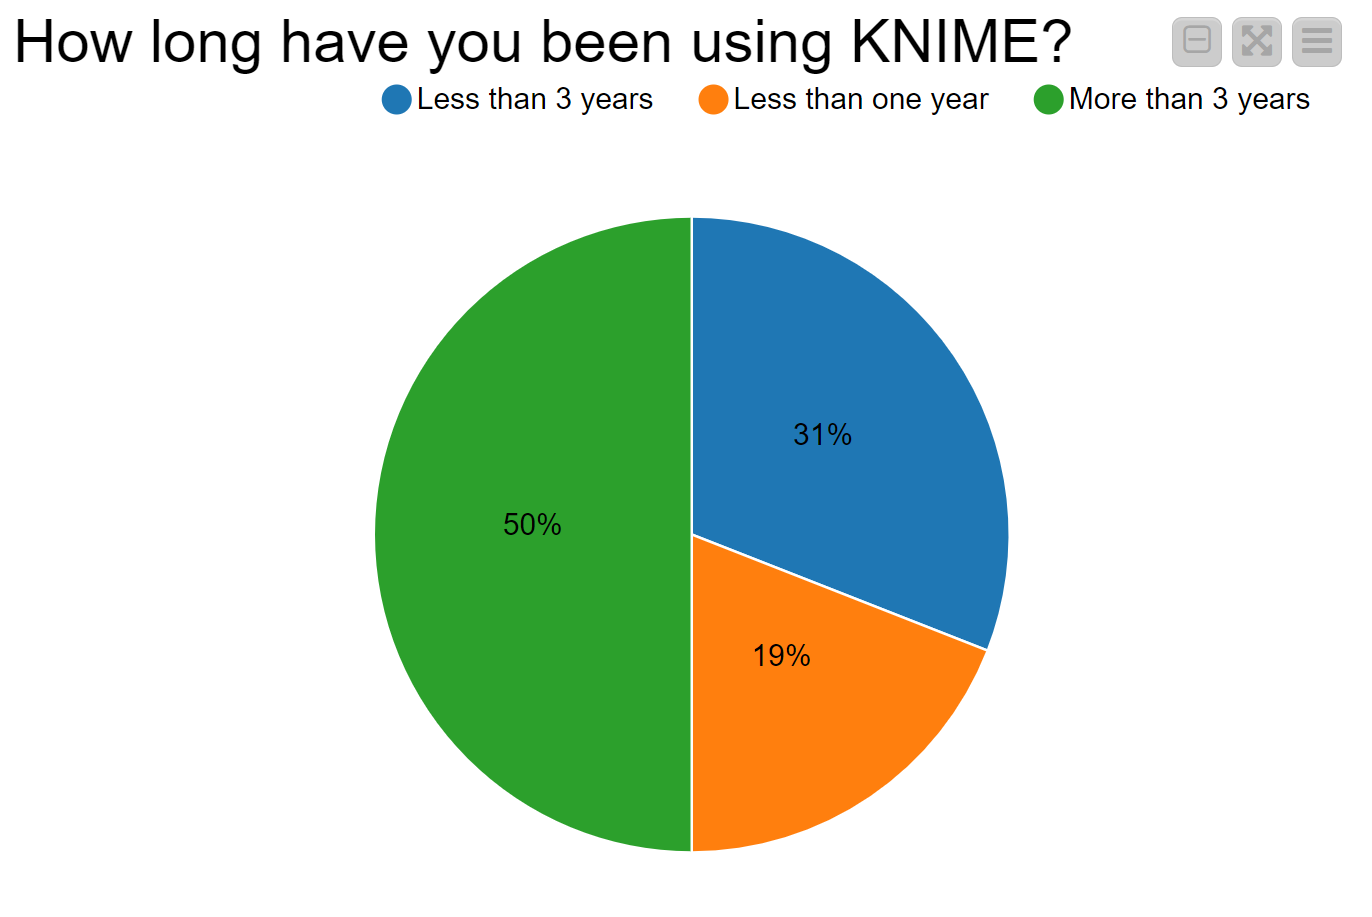
Q: How long have you been using KNIME?
The question “How long have you been using KNIME?” can give us an idea as to what kind of users replied to the survey. We can use a pie chart (Figure 5) to visualize the loyalty of the survey respondents. Based on the feedback given, it looks like half of the respondents are KNIME veterans!
Q: How did you learn to use KNIME?
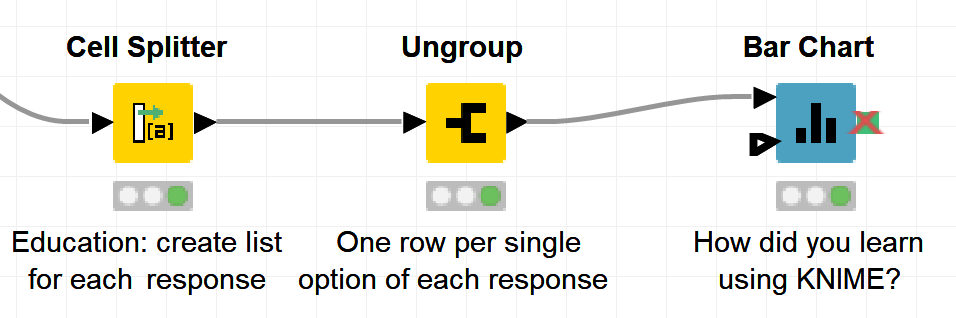
This question offers a multiple choice checkbox since, ideally, one could learn using KNIME from different sources. Multiple answers are then written in the same cell of the spreadsheet, separated by a comma. We can use the Cell Splitter node to transform the concatenation of Strings into a list, then the Ungroup node to create one row for each single selected answer (Figure 6).
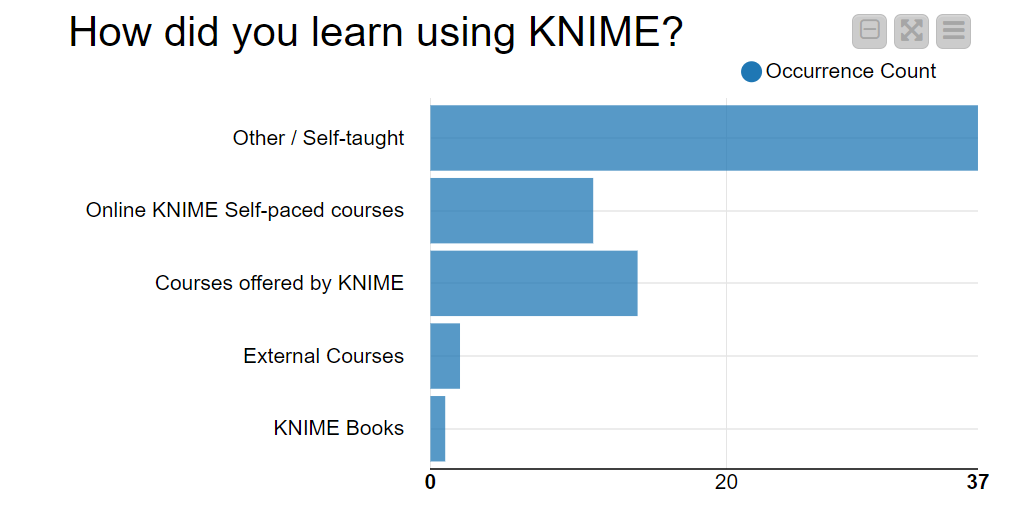
Below, in figure 7, you can see a bar chart showing the popularity of the different learning sources emerging from the responses collected so far. The Other or Self-taught category is prominent, followed by the KNIME courses. For the sake of completeness, we must say that the option “KNIME Books” was added later. This might justify its unpopularity at the moment.
Notice also that we have not been very good at specifying the answer domain, since most of the responses ended up in the mixed category “Other/self-taught” and we cannot discern the actual answer. We might need to review our ontology of possible learning sources for the KNIME software.
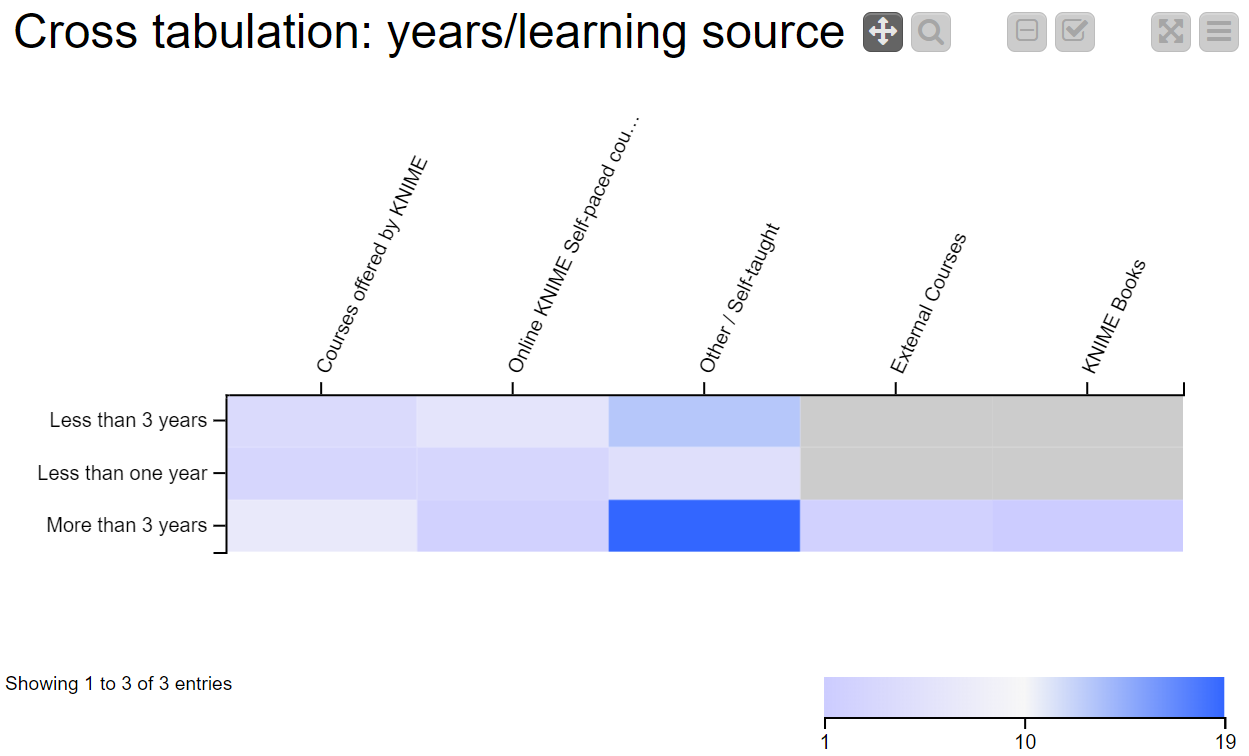
Cross-tabulation analysis of previous questions
Until now we have plotted the results from single questions. Let’s perform a simple cross-tabulation analysis, matching the answers of the two questions above: “How long have you been using KNIME?” vs. “How did you learn to use KNIME?” The final table might give us some hints about the customer preference accorded to the different learning sources over the years.
To create a cross table, let’s use the Pivoting node. We want a table containing one row for each group of past experience (Less than one year, less than 3 years, more than 3 years) and one column for each learning source (KNIME Books, KNIME courses etc…). We have to select the corresponding columns in the Group and Pivot tab of the Pivoting node configuration window, respectively. Then in the Manual Aggregation tab, we can select one random column and set Count as the aggregation method (Figure 8).
To graphically show the resulting pivot table we can use the Heatmap node (figure 9). Although we clearly don’t have enough answers to find conclusions, it seems like lately the number of people that learn by themselves has decreased. Could this be related to the number of KNIME courses and KNIME learning materials, and resources that has exponentially increased over the last few years?
Wrapping up (with components)
To finalize our workflow, let’s create a final dashboard that contains all the plots, in a component. After grouping all the visualization nodes, we can rearrange the items in the composite view and enhance the appearance with a title. Figure 10 shows the final result, with answers from each question.
To sum up what we have covered here: We introduced a Google Form survey open to KNIME users. Next, we imported the responses collected so far into KNIME Analytics Platform using the KNIME Google Connectors nodes.
Please take part in the Survey about using KNIME. After filling it in, you'll have access to all responses and can replicate this experiment in your KNIME Analytics Platform. What will you be able to discover, as new answers come in?
The workflow related to this blogpost is available Survey about using KNIME - Responses dashboard on the KNIME Hub, but I encourage you to build your own dashboard: accessing the data is effortless, creating visualizations is uncomplicated, discovering new information is thrilling!